Fig. 11.
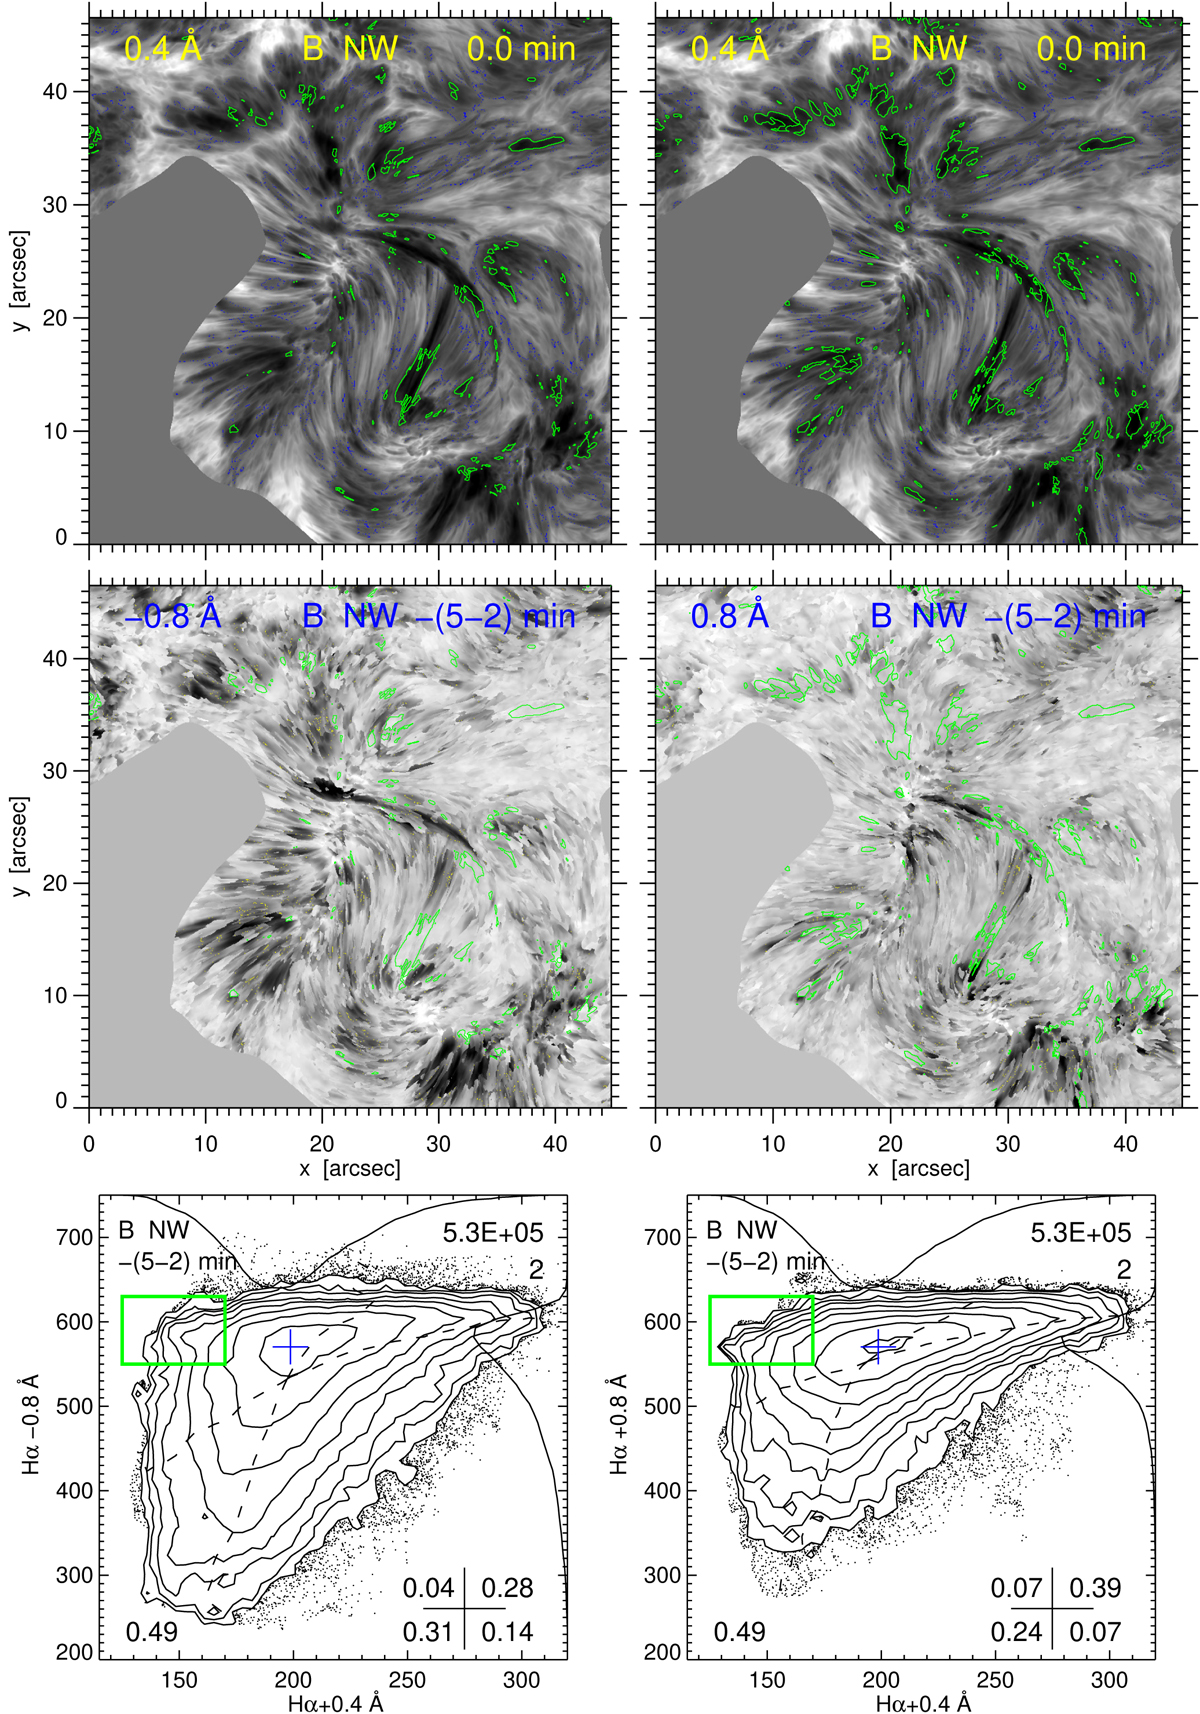
Time-delay scatter analysis in reverse of Fig. 10 for the data B network only. Upper images: darkest-pixel core samplings at Δλ = +0.4 Å. Only the green contours differ. Lower images: at the left we show the darkest value per pixel at Δλ = −0.8 Å to select preceding RBEs during 5 − 2 min before the upper-image pixel sampling times, and at the right we show this at Δλ = +0.8 Å to select preceding RREs. Scatter diagrams: corresponding pixel-by-pixel correlations. The green boxes and contours select darkest red-core pixels without preceding blue-wing or red-wing darkening, respectively. Online image blinkers: 1–3 and 2–4 without contours, 3–4 with contours.
Current usage metrics show cumulative count of Article Views (full-text article views including HTML views, PDF and ePub downloads, according to the available data) and Abstracts Views on Vision4Press platform.
Data correspond to usage on the plateform after 2015. The current usage metrics is available 48-96 hours after online publication and is updated daily on week days.
Initial download of the metrics may take a while.