Fig. 10.
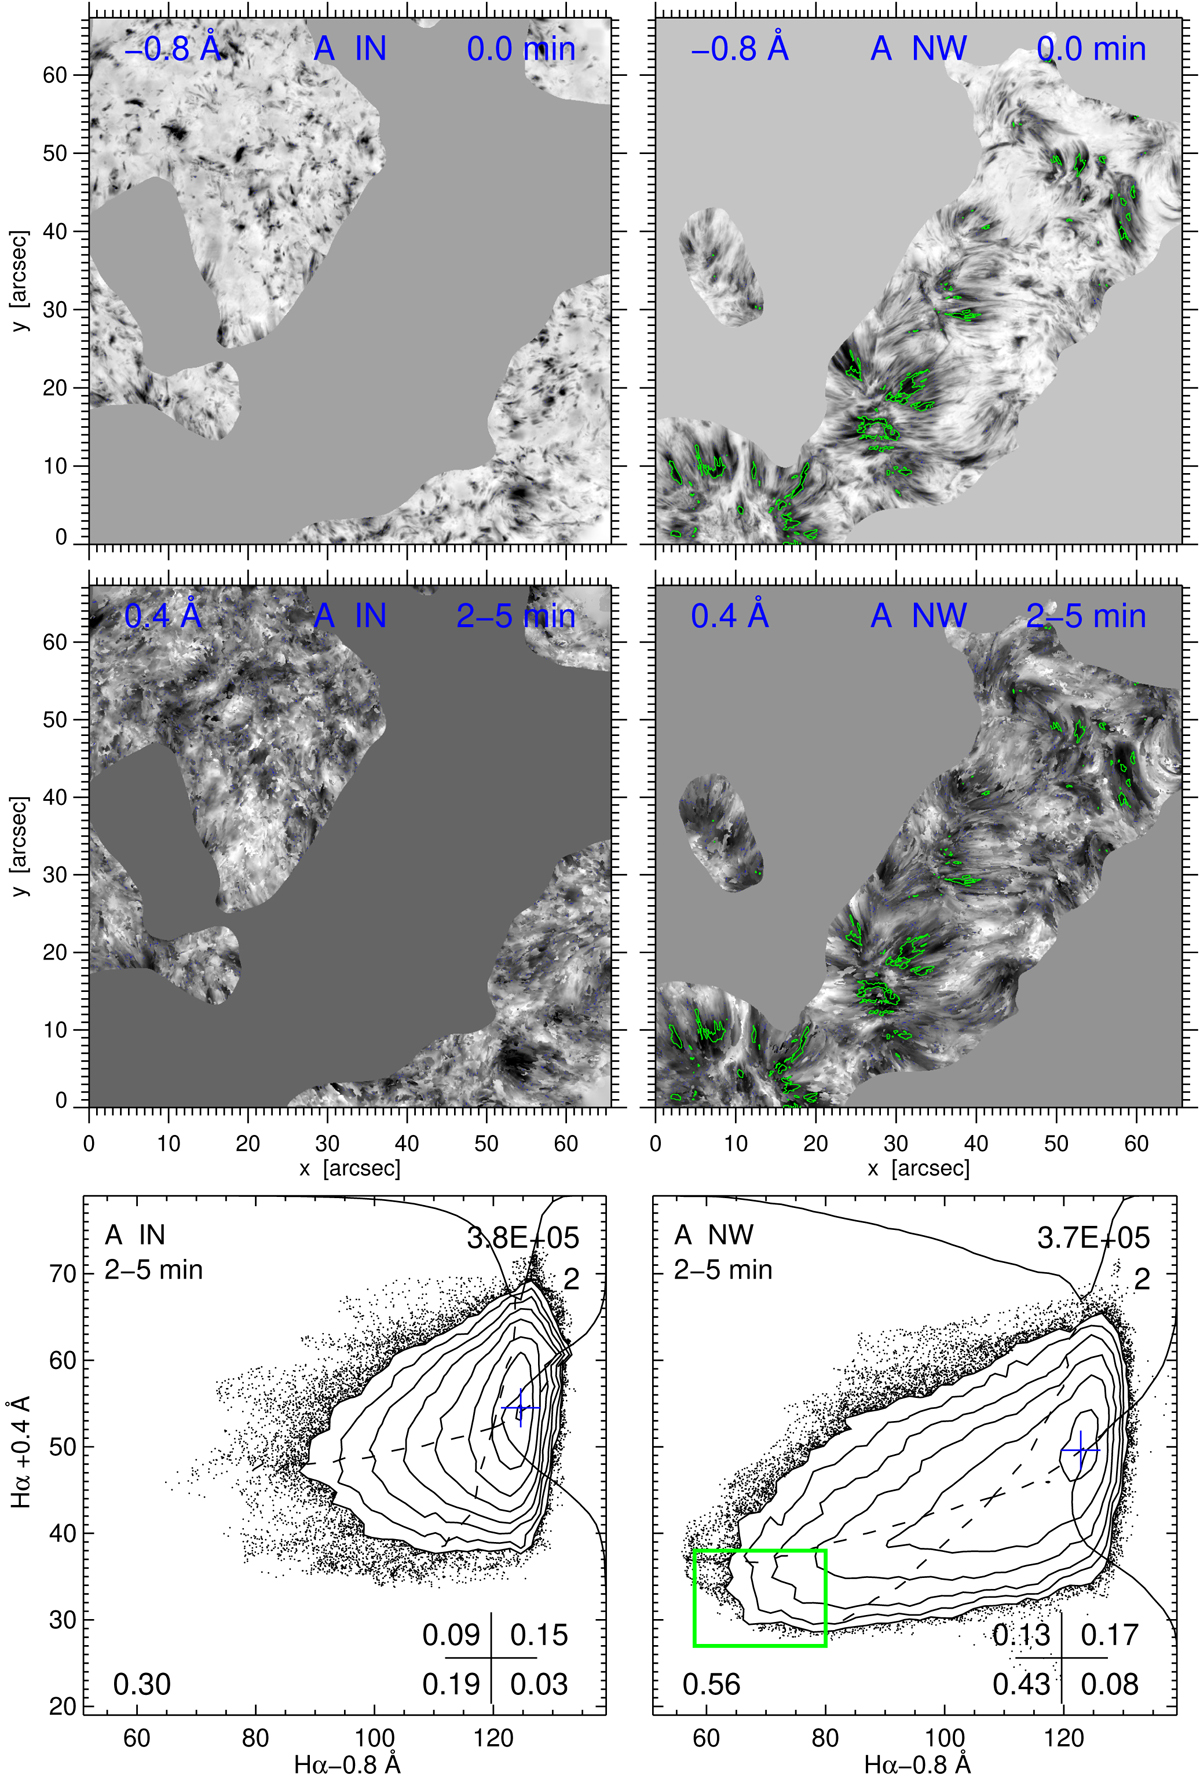
Time-delay scatter analysis for the darkest RBE moments in data A only, in the same way as in the first columns of Fig. 9, but selecting internetwork (left, label IN) and network (right, label NW). Upper images: darkest value per pixel at Δλ = − 0.8 Å. Lower images: darkest value per pixel at Δλ = + 0.4 Å during 2 − 5 min delay after the upper-image pixel sampling. Scatter diagrams: corresponding pixel-by-pixel correlations. The green box and contours select darkest-RBE and darkest delayed red-core pixels in the network areas. Online image blinkers: 1–3, 2–4.
Current usage metrics show cumulative count of Article Views (full-text article views including HTML views, PDF and ePub downloads, according to the available data) and Abstracts Views on Vision4Press platform.
Data correspond to usage on the plateform after 2015. The current usage metrics is available 48-96 hours after online publication and is updated daily on week days.
Initial download of the metrics may take a while.