Fig. 1.
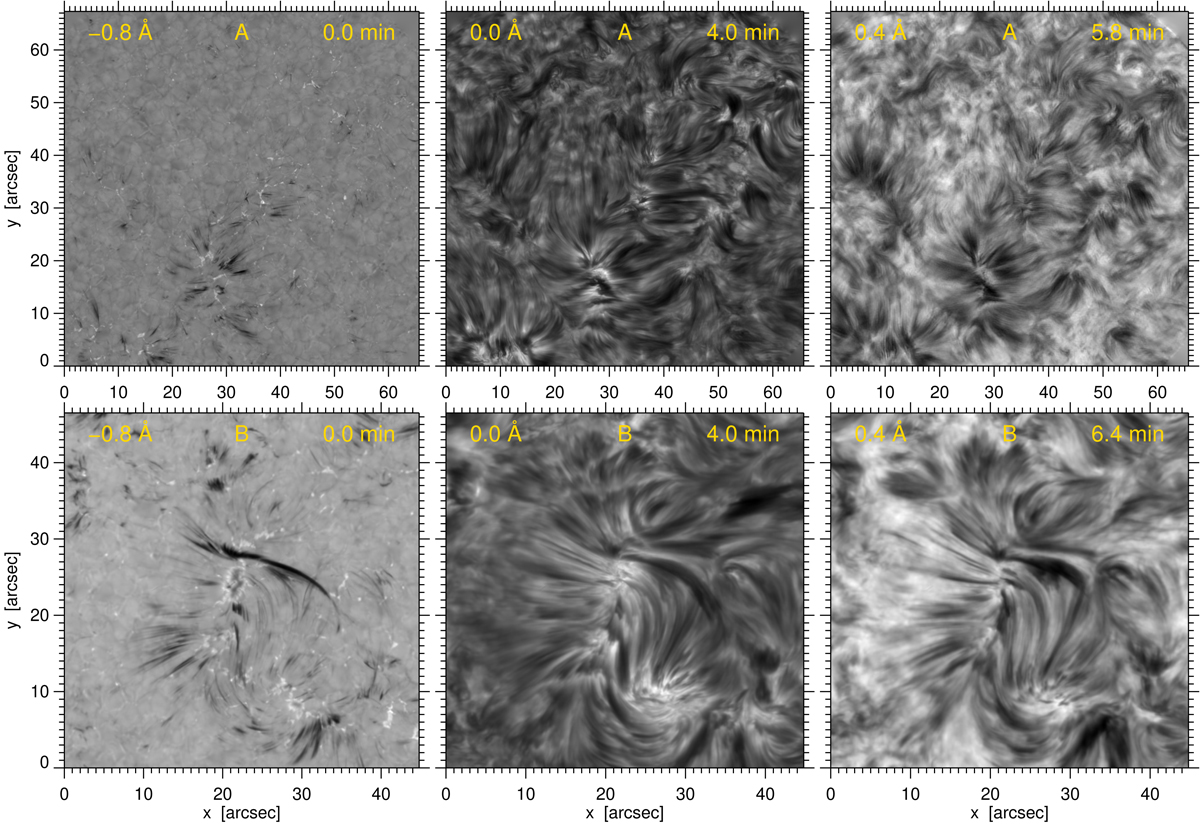
Full-field overviews for data A (upper row) and data B (lower row). First column: Hα blue-wing intensity at Δλ = −0.8 Å. Second column: Hα line-center intensity 4 min later. Third column: Hα red-core intensity at Δλ = +0.4 Å about 6 min after the first column. Each panel is bytescaled independently. The data A images start at the best-seeing moment. The data B images sample the Pub B PHE, contrail fiber, and return aftermath. The timings are marked by triangles in Fig. 2. Online blinkers for these images (for page flipping per pdf viewer in single-page, fit-to-page, or full-screen mode): 1–2, 1–3, 4–5, 4–6).
Current usage metrics show cumulative count of Article Views (full-text article views including HTML views, PDF and ePub downloads, according to the available data) and Abstracts Views on Vision4Press platform.
Data correspond to usage on the plateform after 2015. The current usage metrics is available 48-96 hours after online publication and is updated daily on week days.
Initial download of the metrics may take a while.