Fig. 3.
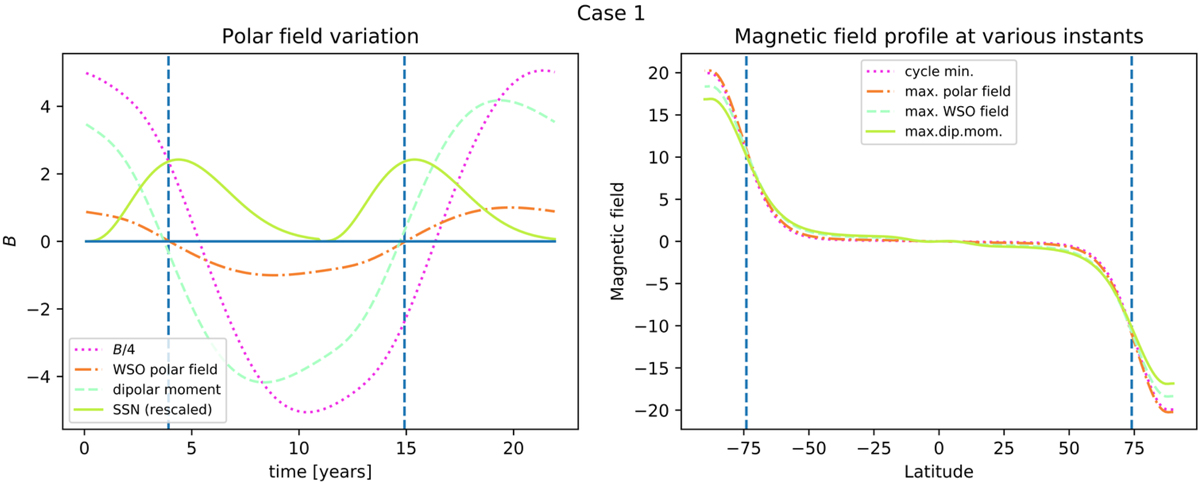
Example of a solution satisfying all observational constraints on the polar magnetic field: temporal variation and latitudinal profiles for u0 = 10 m s−1, η = 600 km2 s−1 and τ = 7 yr (Flow 1). Time variations of various quantities are shown in the left panel: in the label of the dotted curve B refers to the field amplitude at the pole; vertical dashed lines mark the reversals of the WSO polar field. Right panel: latitudinal profile of the magnetic field at various instants as indicated; vertical dashed lines mark the latitudes where B equals half its value at the poles at cycle minimum.
Current usage metrics show cumulative count of Article Views (full-text article views including HTML views, PDF and ePub downloads, according to the available data) and Abstracts Views on Vision4Press platform.
Data correspond to usage on the plateform after 2015. The current usage metrics is available 48-96 hours after online publication and is updated daily on week days.
Initial download of the metrics may take a while.