Fig. 1.
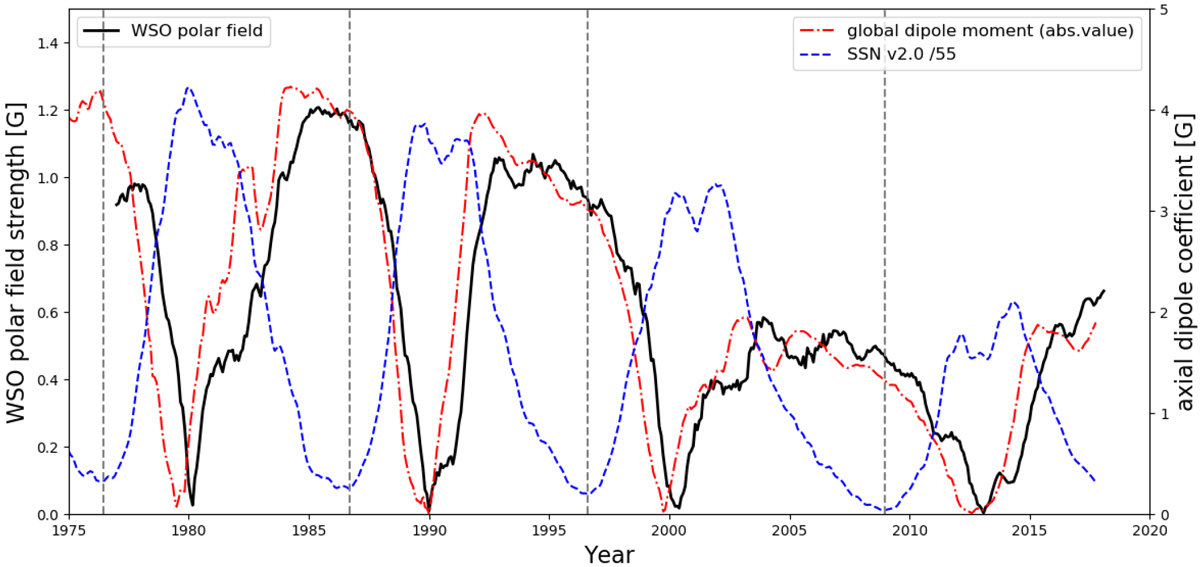
Hemispherically averaged polar field amplitude from the WSO data set (black solid) and the global axial dipole moment (red dot-dashed) as a function of time. The monthly sunspot number series (blue dashed) is shown for comparison, with an arbitrary rescaling. All curves were smoothed with a 13-month sliding window. Times of sunspot minima are marked by the dashed vertical lines. Global dipole amplitudes were obtained by courtesy of Jie Jiang and represent the average of values computed for all available data sets at the given time (Jiang et al. 2018).
Current usage metrics show cumulative count of Article Views (full-text article views including HTML views, PDF and ePub downloads, according to the available data) and Abstracts Views on Vision4Press platform.
Data correspond to usage on the plateform after 2015. The current usage metrics is available 48-96 hours after online publication and is updated daily on week days.
Initial download of the metrics may take a while.