Free Access
Fig. 4.
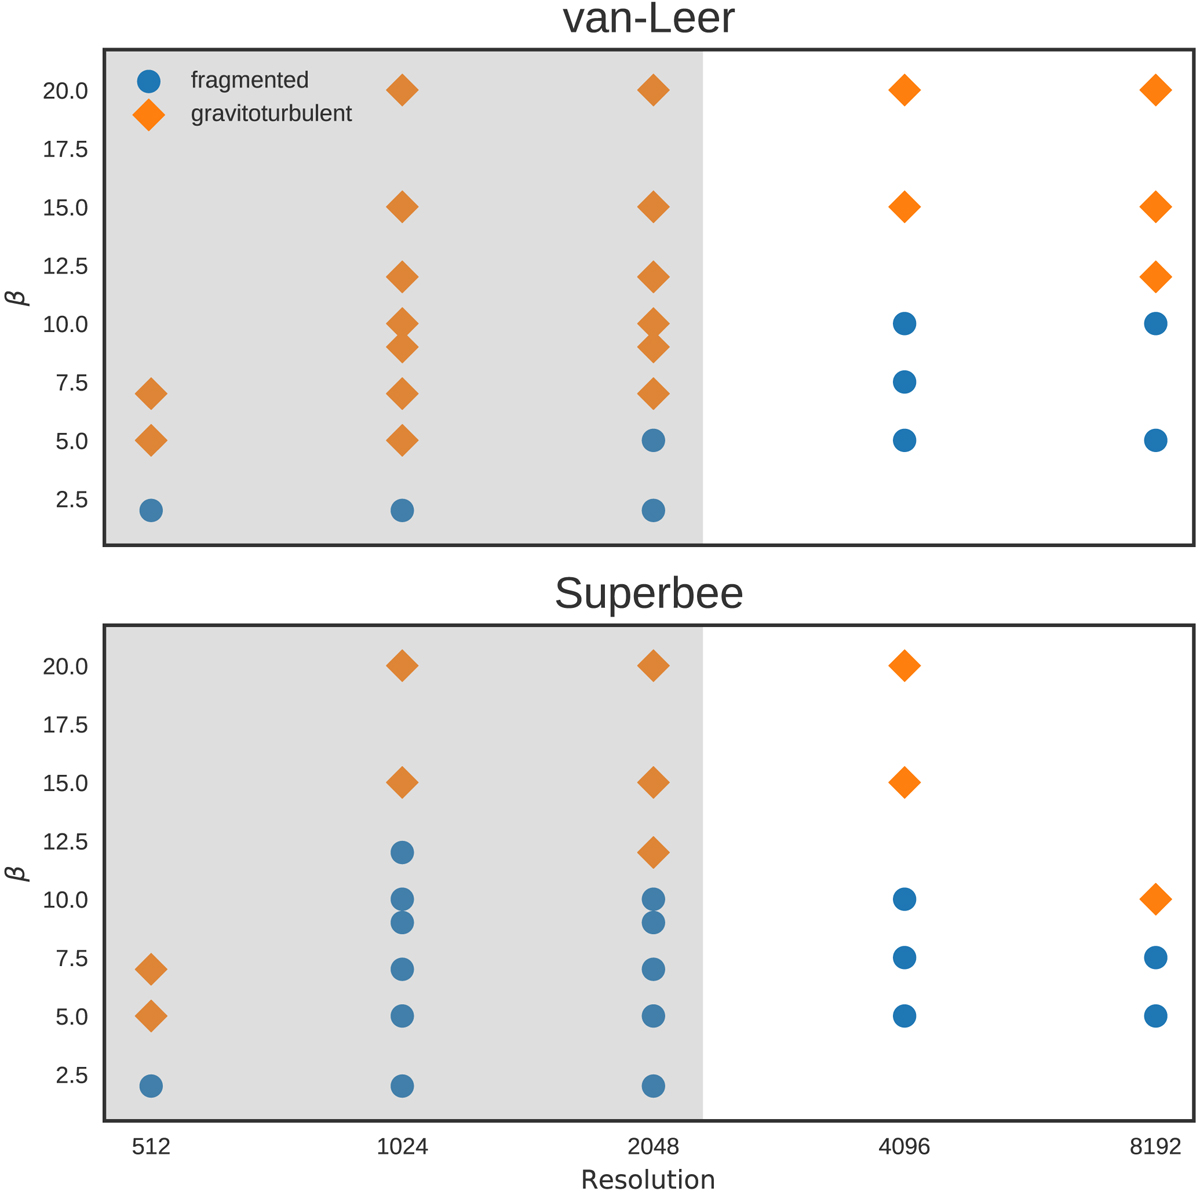
Fragmentation plot for different resolutions N and cooling timescales β. The grey regions show results already published in Klee et al. (2017). The simulations seem to converge at the highest resolutions to a value of βcrit ≈ 10 for both numerical schemes.
Current usage metrics show cumulative count of Article Views (full-text article views including HTML views, PDF and ePub downloads, according to the available data) and Abstracts Views on Vision4Press platform.
Data correspond to usage on the plateform after 2015. The current usage metrics is available 48-96 hours after online publication and is updated daily on week days.
Initial download of the metrics may take a while.