Fig. 3.
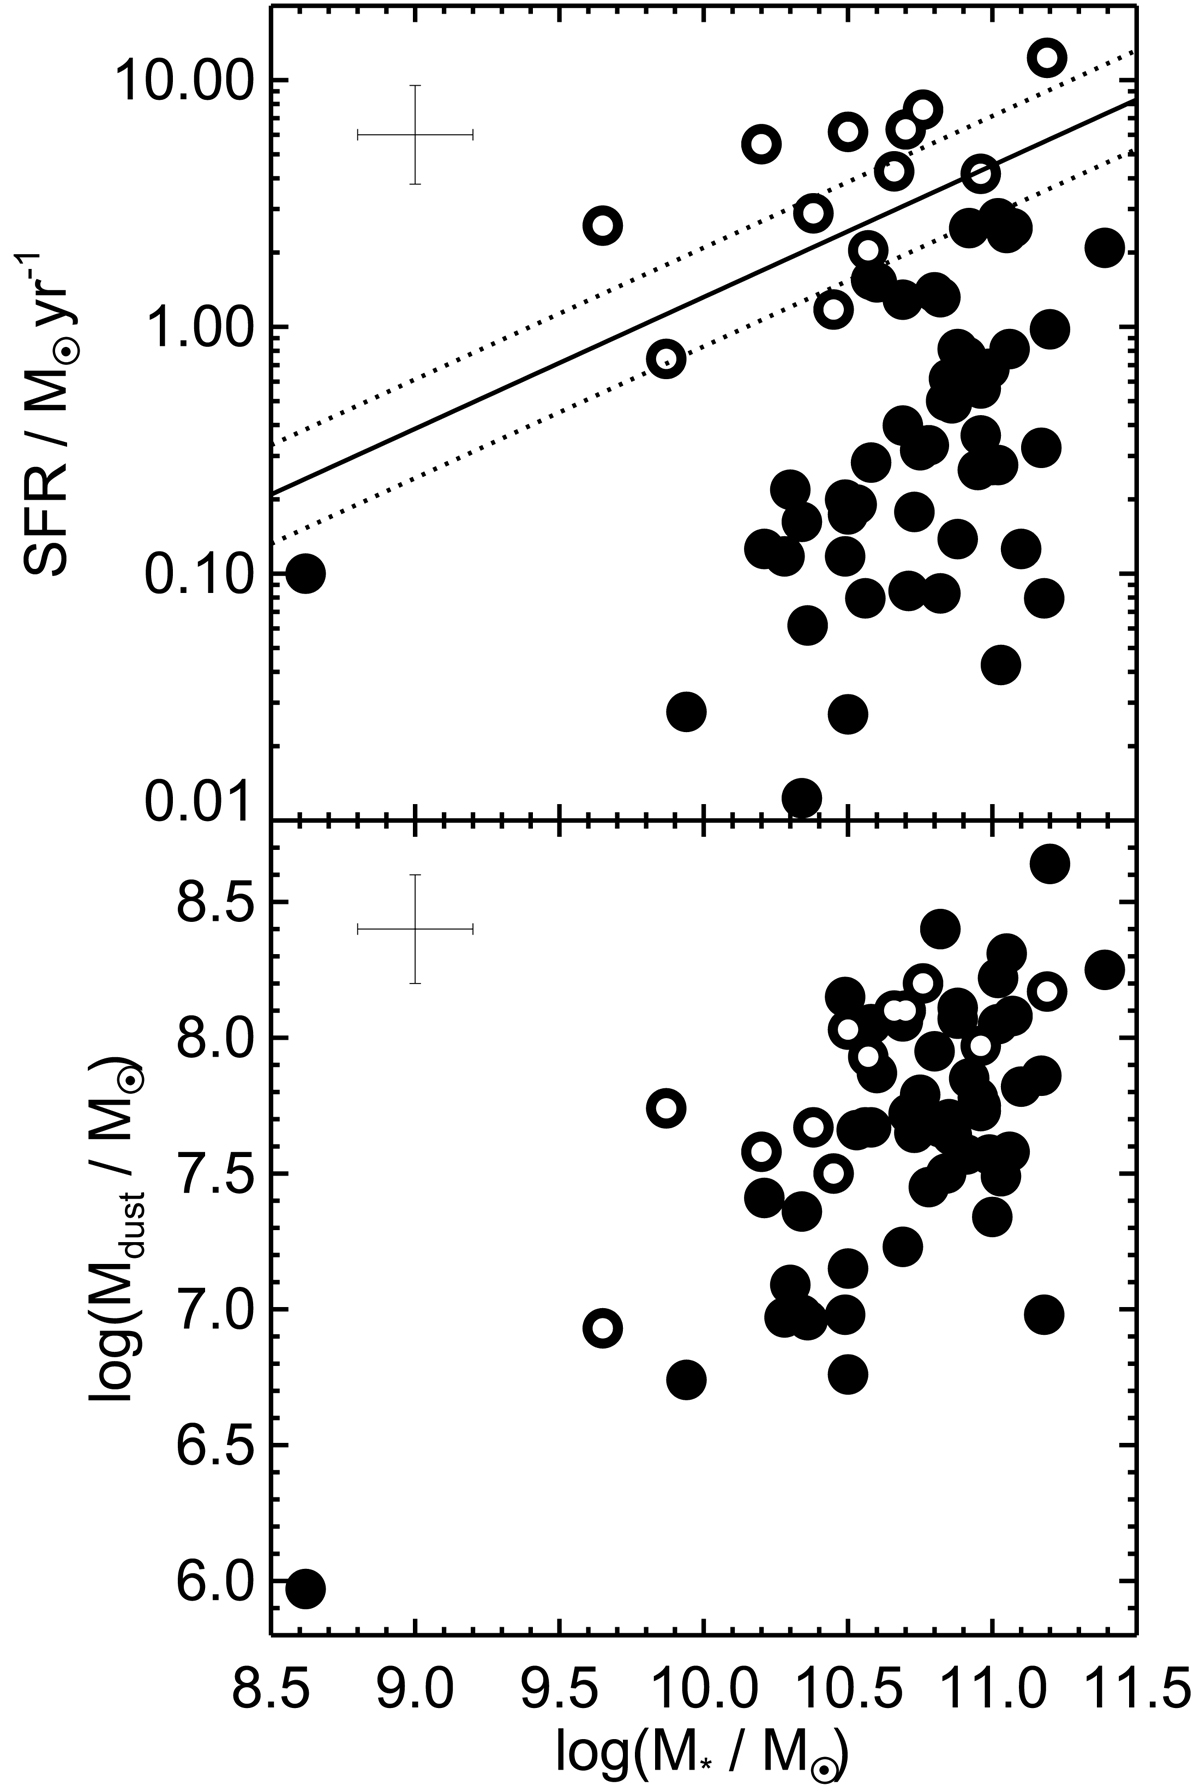
SFR (top) and dust mass (bottom) as function of stellar mass derived by Rowlands et al. (2012). The star formation main sequence at z = 0.13 is plotted as a solid line, with the scatter shown as dotted lines (Speagle et al. 2014). The early-type galaxies within the main sequence are plotted as open symbols. Filled symbols which appear to be within the main sequence are galaxies at higher redshifts, for which the main-sequence is higher. The typical errors are shown as large crosses. The Spearman rank correlation coefficient for the Md − M* diagram is 0.5 with a very small probability (∼3 × 10⁻⁵, ∼4σ) of the null hypothesis (no correlation) being acceptable.
Current usage metrics show cumulative count of Article Views (full-text article views including HTML views, PDF and ePub downloads, according to the available data) and Abstracts Views on Vision4Press platform.
Data correspond to usage on the plateform after 2015. The current usage metrics is available 48-96 hours after online publication and is updated daily on week days.
Initial download of the metrics may take a while.