Fig. 1.
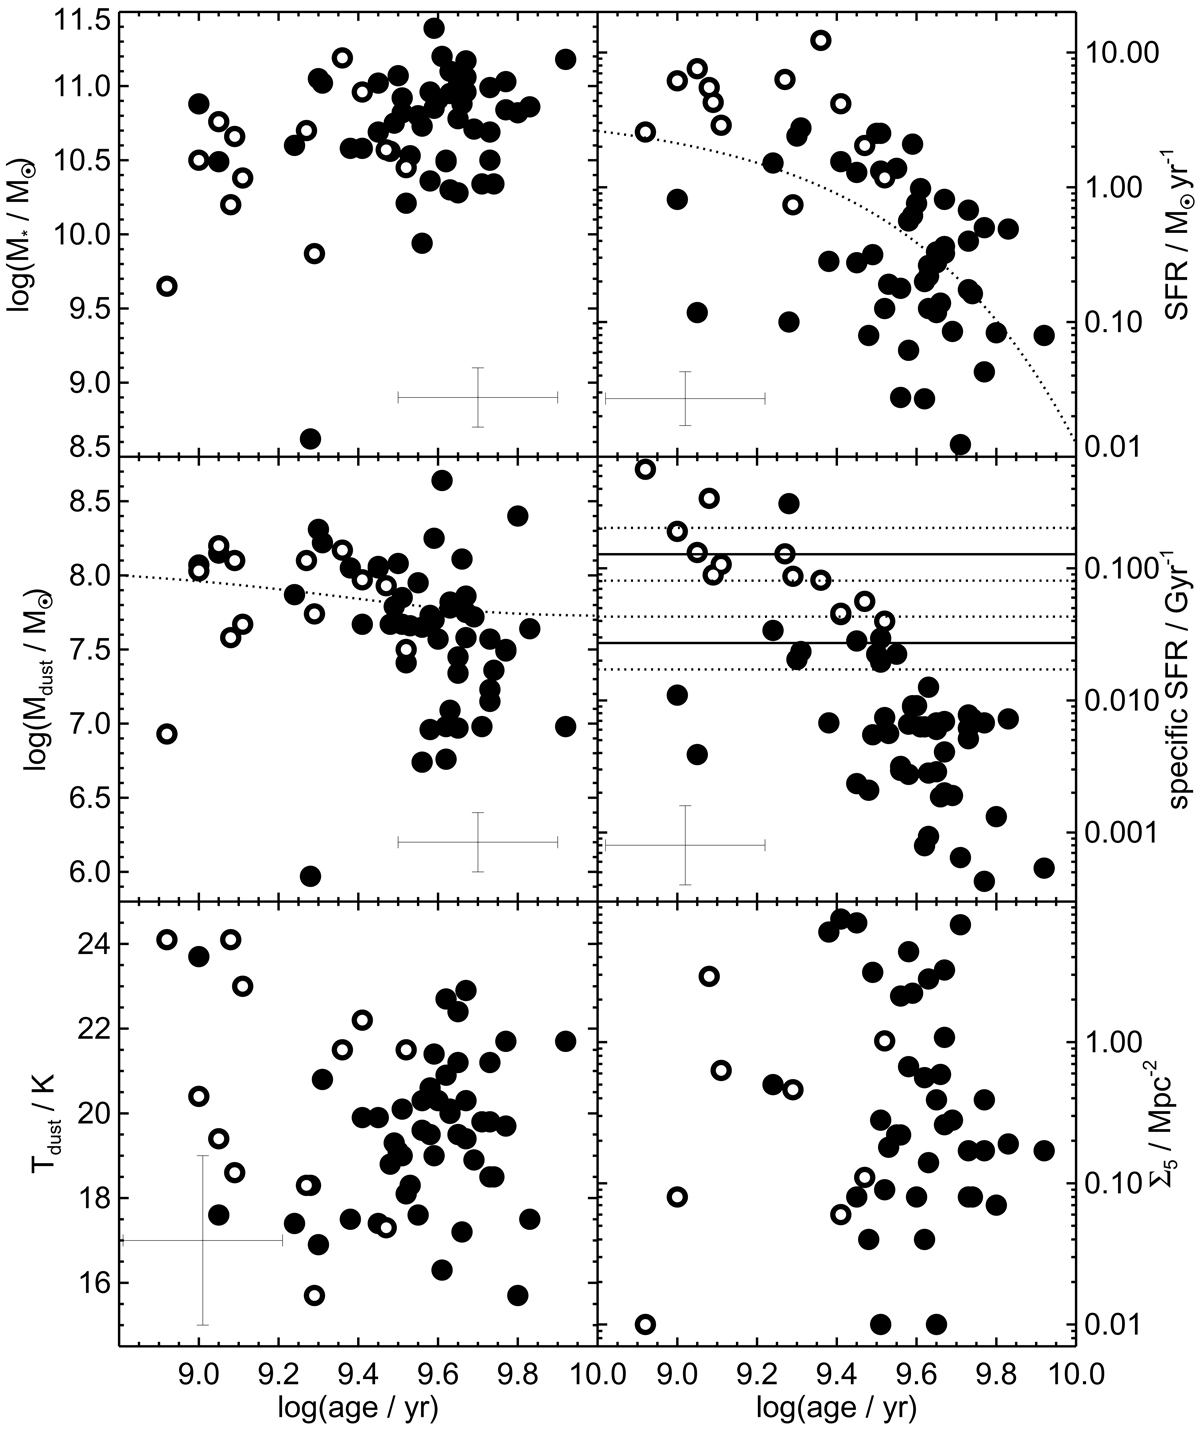
Stellar mass (top left), SFR (top right), dust mass (middle left), specific SFR (middle right), temperature of cold diffuse ISM dust component (bottom left) and galaxy number surface density (bottom right) derived by Rowlands et al. (2012) as function of luminosity-weighted stellar age. The typical errors are shown as large crosses. On the SFR panel, the dotted line shows the exponential fit to the data, whereas on the Mdust panel, the dotted line denotes the evolution of dust mass affected only by astration resulting from this fit and the assumption of the gas-to-dust mass ratio of 100. A higher ratio would result in an even flatter evolution. The specific SFR panel shows the star formation main sequence at z = 0.13 for stellar masses of log(M*/M⊙) = 10 (higher line) and 11.5 (lower line) as solid lines, with the scatter shown as dotted lines (Speagle et al. 2014). The galaxy number surface density is defined as ![]() , where d5 is the projected comoving distance to the 5th nearest neighbour within ±1000 km s−1. Open circles denote galaxies which are within the main sequence (see Fig. 3). Filled symbols which appear to be within the main sequence are galaxies at higher redshifts, for which the main-sequence is higher.
, where d5 is the projected comoving distance to the 5th nearest neighbour within ±1000 km s−1. Open circles denote galaxies which are within the main sequence (see Fig. 3). Filled symbols which appear to be within the main sequence are galaxies at higher redshifts, for which the main-sequence is higher.
Current usage metrics show cumulative count of Article Views (full-text article views including HTML views, PDF and ePub downloads, according to the available data) and Abstracts Views on Vision4Press platform.
Data correspond to usage on the plateform after 2015. The current usage metrics is available 48-96 hours after online publication and is updated daily on week days.
Initial download of the metrics may take a while.