Fig. 8
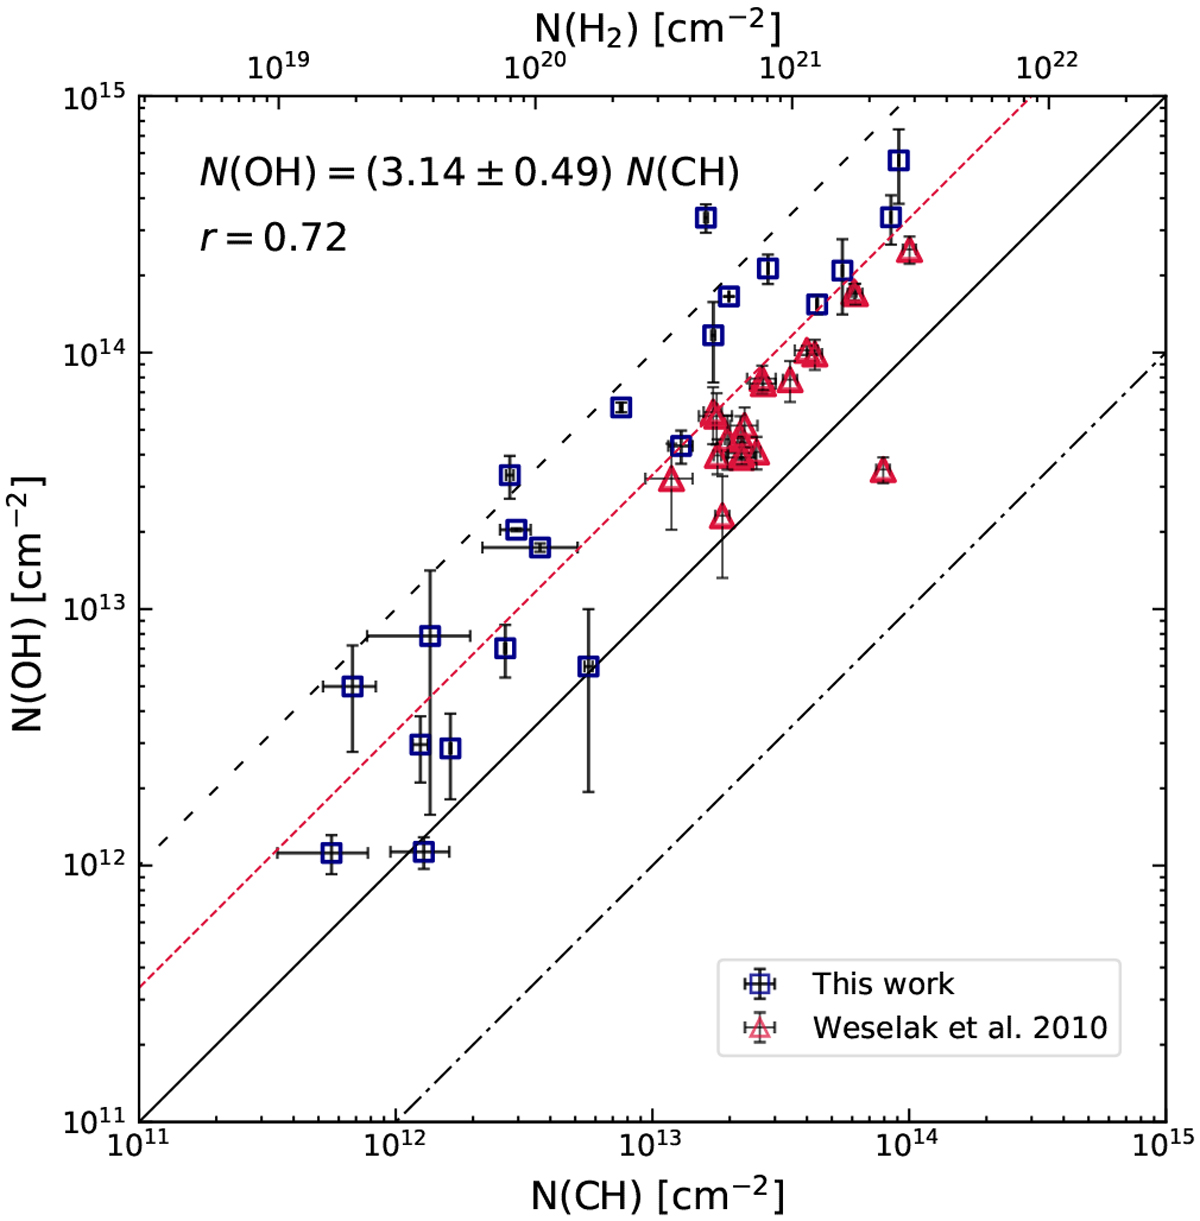
Correlation plot between column densities of the CH, and OH molecules, integrated over broad velocity intervals asper Table 3. The red triangles and blue squares represent column density measures from Weselak et al. (2010) and this work, respectively. The black dashed, solid, and dotted-dashed lines indicate N(OH)/N(CH) ratios of 10, one, and 0.1, respectively while the linear regression fit to the data, N(OH) = (3.15 ± 0.49) N(CH) is displayed by the red dotted line.
Current usage metrics show cumulative count of Article Views (full-text article views including HTML views, PDF and ePub downloads, according to the available data) and Abstracts Views on Vision4Press platform.
Data correspond to usage on the plateform after 2015. The current usage metrics is available 48-96 hours after online publication and is updated daily on week days.
Initial download of the metrics may take a while.