Fig. 7
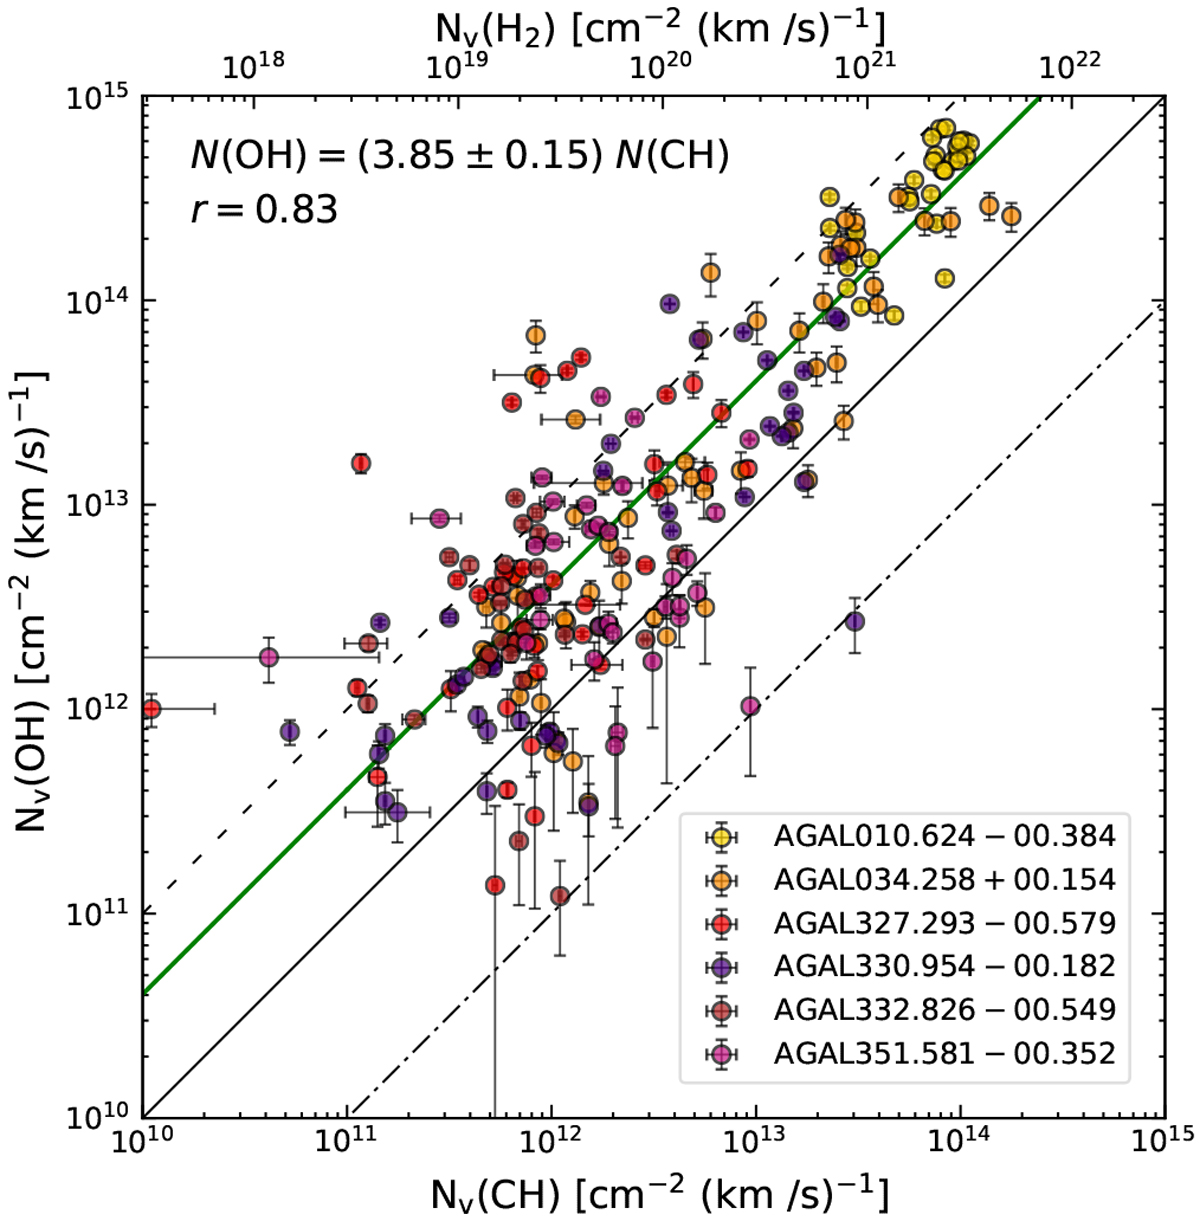
N(OH) vs. N(CH), per unit velocity interval derived using WF algorithm. The different coloured data points represent contributions from the different sources. The black dashed, solid, and dotted-dashed lines indicate N(OH)/N(CH) ratios of 10, one, and 0.1, respectively while the linear regression fit to the data, N(OH) = (3.85 ± 0.15) N(CH) is displayed in green.
Current usage metrics show cumulative count of Article Views (full-text article views including HTML views, PDF and ePub downloads, according to the available data) and Abstracts Views on Vision4Press platform.
Data correspond to usage on the plateform after 2015. The current usage metrics is available 48-96 hours after online publication and is updated daily on week days.
Initial download of the metrics may take a while.