Fig. 6
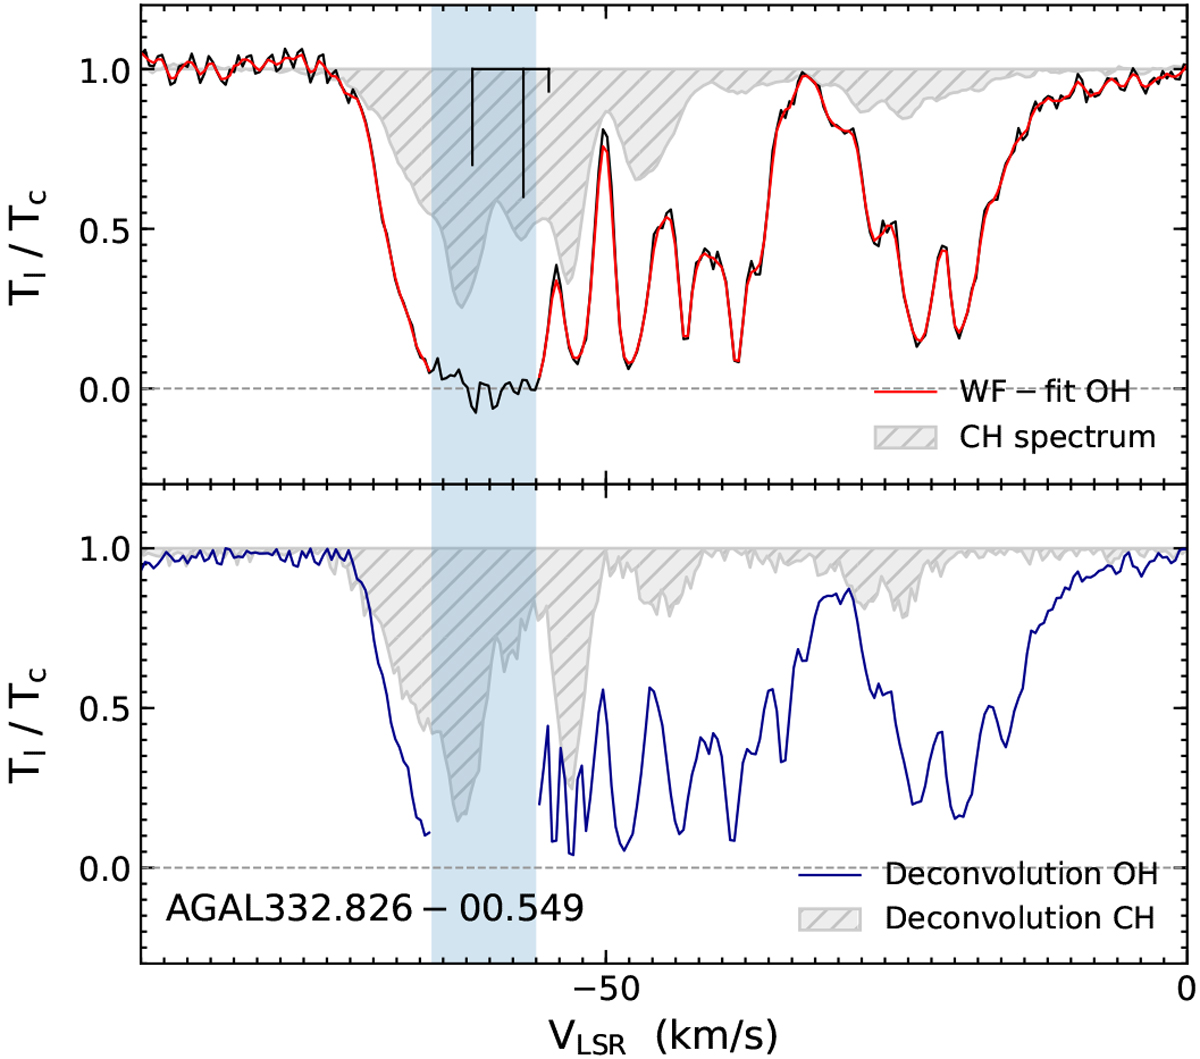
Top: normalised line profile and HFS structure of OH near 2514 GHz (in black) overlaid with WF fit in red toward AGAL332.826 − 00.549. The WF fit avoids velocity intervals of the OH spectrum that show saturation between −65 < vlsr <-56 km s−1, bounded by the blue-shaded regions. The grey shaded and hatched region displays the CH absorption profile toward the same sourcefor comparison. Bottom: normalised WF deconvolved line profile of OH (avoiding the saturated region) in blue, and corresponding deconvolved spectrum of CH displayed by the shaded and hatched grey region.
Current usage metrics show cumulative count of Article Views (full-text article views including HTML views, PDF and ePub downloads, according to the available data) and Abstracts Views on Vision4Press platform.
Data correspond to usage on the plateform after 2015. The current usage metrics is available 48-96 hours after online publication and is updated daily on week days.
Initial download of the metrics may take a while.