Fig. 5
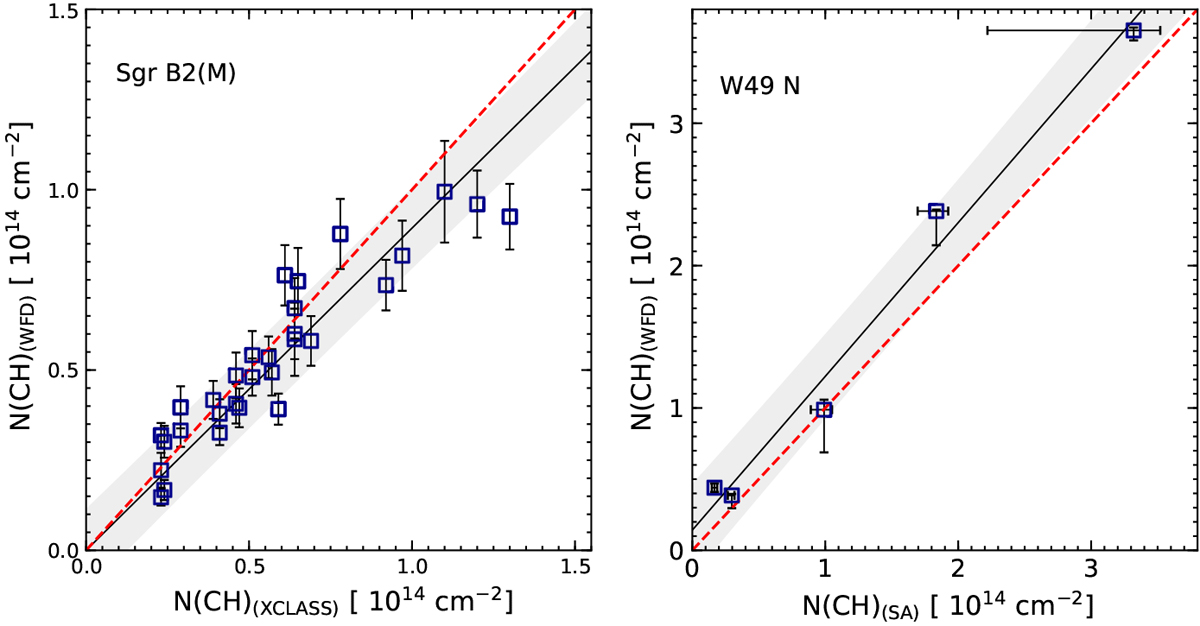
Left: comparison of N = 1, J = 3∕2 → 1∕2 CH column densities derived using WF deconvolution and the XCLASS software presented in Qin et al. (2010). Right: comparison of N, J = 2, 3∕2 → 1, 1∕2 CH column densities derived using WF deconvolution and the simulated annealing algorithm presented in Wiesemeyer et al. (2018). The black solid line represents the weighted fit to the data, while the red dashed line represents a ratio of one. The data points that lie within 1σ intervals of the weighted linear regression are indicated by the grey-shaded regions.
Current usage metrics show cumulative count of Article Views (full-text article views including HTML views, PDF and ePub downloads, according to the available data) and Abstracts Views on Vision4Press platform.
Data correspond to usage on the plateform after 2015. The current usage metrics is available 48-96 hours after online publication and is updated daily on week days.
Initial download of the metrics may take a while.