Fig. 4
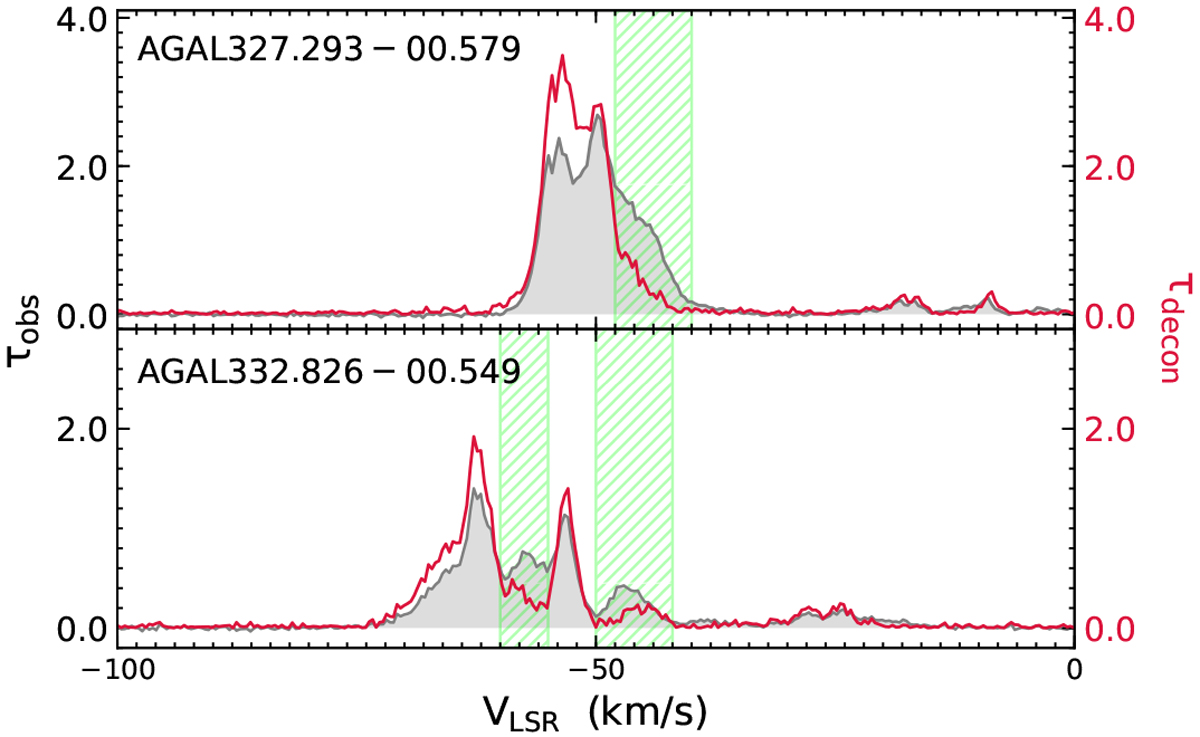
Example illustrating effects of HFS splitting. The grey-filled area represents the observed spectra toward AGAL327.293 − 00.579 (top) and AGAL332.826 − 00.549 (bottom) in terms of optical depth, while their WF deconvolved spectra are displayed in red. The green hashed regions indicate velocity intervals where we observe line broadening due to HFS splitting.
Current usage metrics show cumulative count of Article Views (full-text article views including HTML views, PDF and ePub downloads, according to the available data) and Abstracts Views on Vision4Press platform.
Data correspond to usage on the plateform after 2015. The current usage metrics is available 48-96 hours after online publication and is updated daily on week days.
Initial download of the metrics may take a while.