Fig. 3
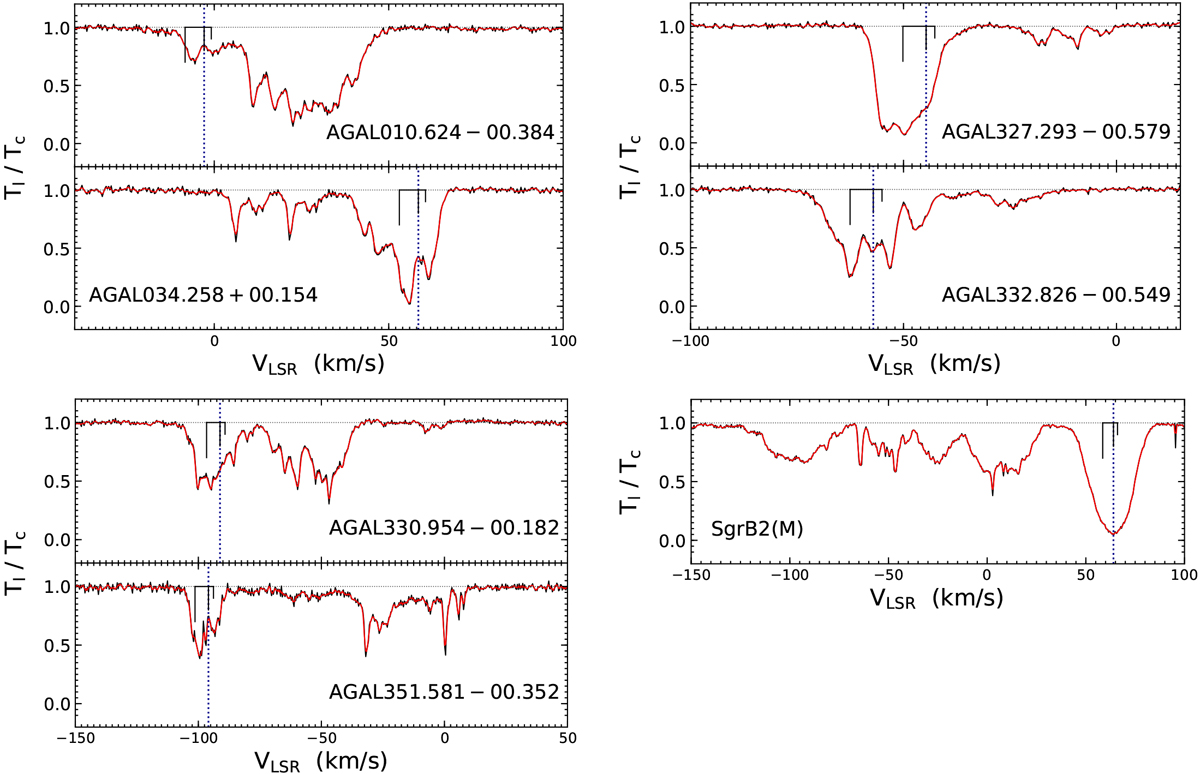
CH (N, J = 2, 3∕2 → 1, 1∕2) hyperfine transition spectra observed toward (from top) AGAL010.624 − 00.384, AGAL034.258+00.154, AGAL327.293 − 00.579, AGAL332.826 − 00.549, AGAL330.954 − 00.182, AGAL351.581 − 00.352, and SgrB2(M) using GREAT/SOFIA. Each spectrum is normalized with respect to its continuum level. The WF fits are overlaid in red and include the HFS structure. The positions and relative intensities of the HFS structure are displayed in black. Sources with similar velocity distributions were grouped to display the absorption features along the LOS, in detail. The systemic velocities of the sources are represented by the dotted blue lines.
Current usage metrics show cumulative count of Article Views (full-text article views including HTML views, PDF and ePub downloads, according to the available data) and Abstracts Views on Vision4Press platform.
Data correspond to usage on the plateform after 2015. The current usage metrics is available 48-96 hours after online publication and is updated daily on week days.
Initial download of the metrics may take a while.