Fig. F.1
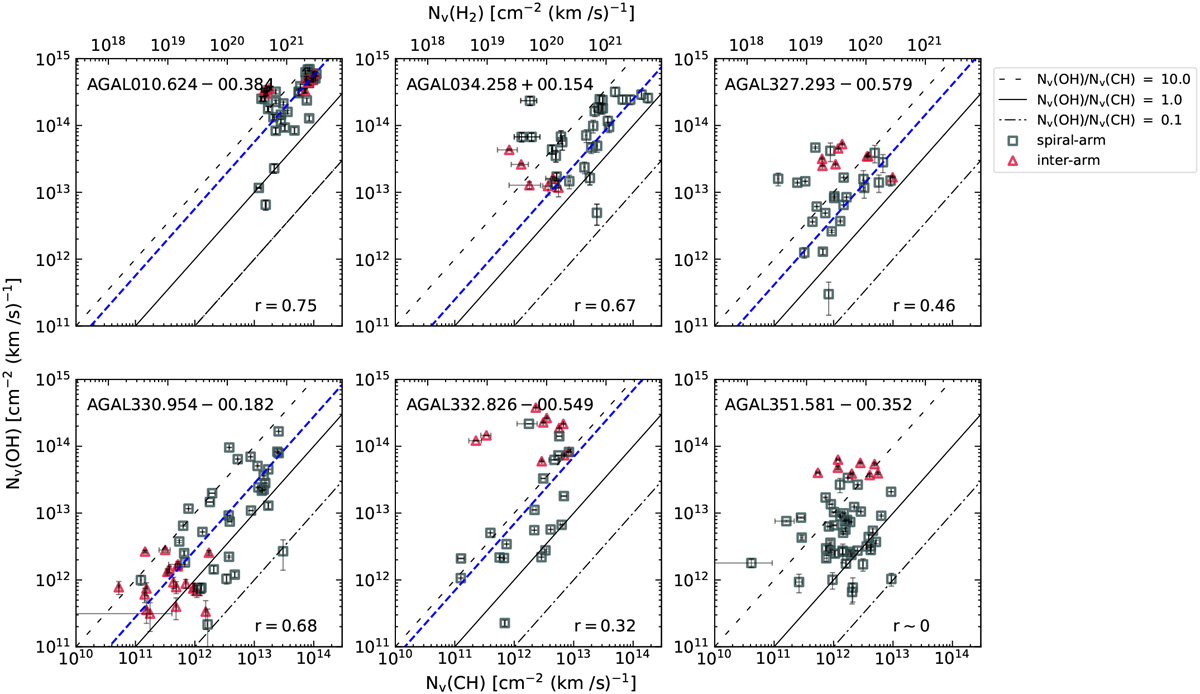
Correlation between CH and OH column densities derived using the WF deconvolution algorithm toward (clockwise from top left) AGAL010.624 − 00.384, AGAL034.258+00.154, AGAL327.293 − 00.579, AGAL330.954 − 00.182, AGAL332.826 − 00.549 and AGAL351.58 − 00.352. The different markers indicate contributions from spiral-arm (in blue), and inter-arm gas (in red). The linear regression is shown by the blue dashed line along with N(OH)/N(CH) ratios of 0.1, one and 10. Secondary x-axis represents H2 column densities obtained using the CH/H2 abundance ratio given by Sheffer et al. (2008). The corresponding Pearson’s correlation coefficients are given in the lower-right corners.
Current usage metrics show cumulative count of Article Views (full-text article views including HTML views, PDF and ePub downloads, according to the available data) and Abstracts Views on Vision4Press platform.
Data correspond to usage on the plateform after 2015. The current usage metrics is available 48-96 hours after online publication and is updated daily on week days.
Initial download of the metrics may take a while.