Fig. B.1
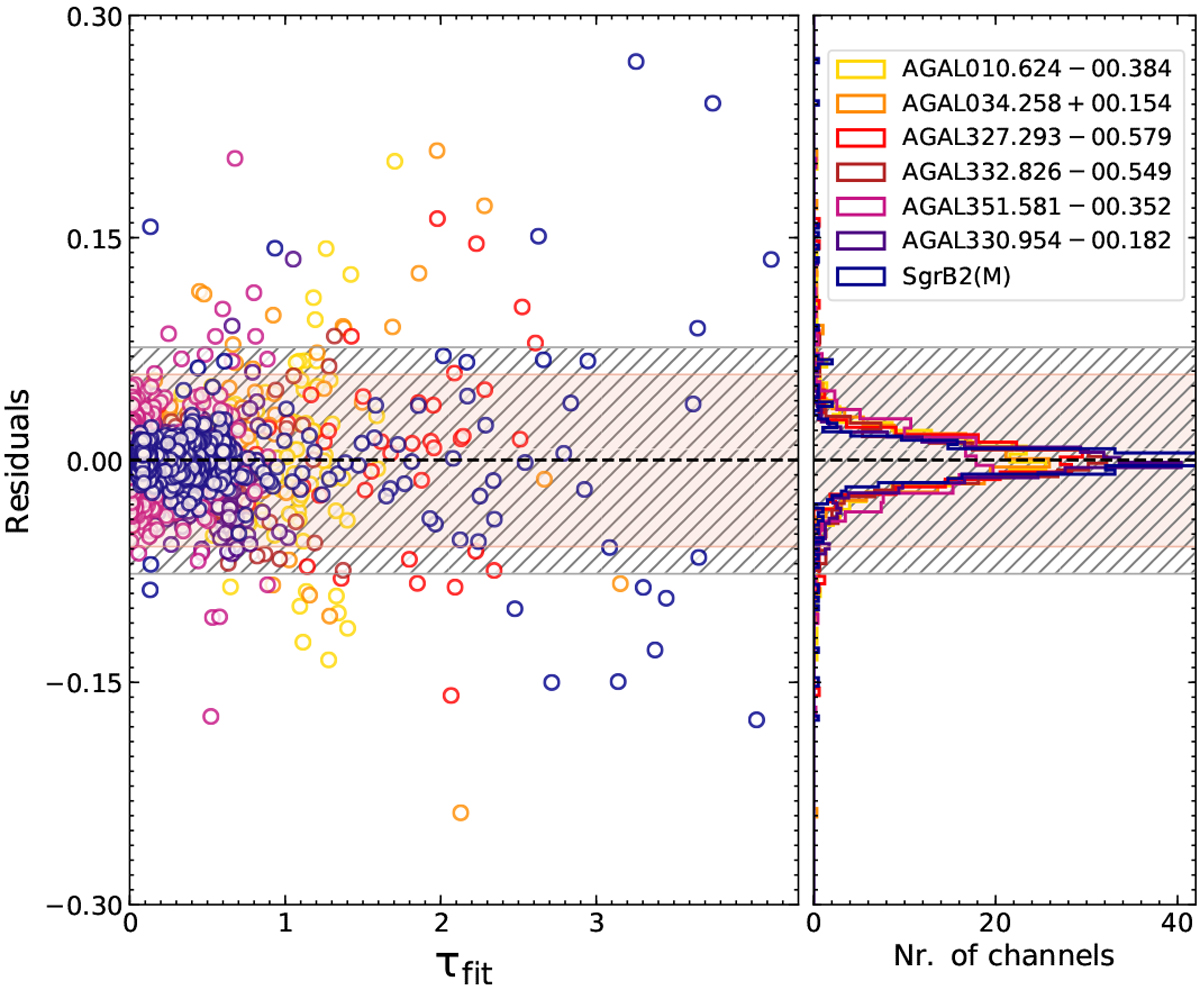
Left panel: optical depth residuals vs. WF fit. The different coloured markers correspond to residuals computed from the WF fits to the different sources. Right panel: distribution of residuals corresponding to different sources. They follow approximate normal distributions centred slightly off-zero around +0.001 for all seven sources. The grey (hatched) and pink regions bound the 99 and 95% confidence intervals, respectively.
Current usage metrics show cumulative count of Article Views (full-text article views including HTML views, PDF and ePub downloads, according to the available data) and Abstracts Views on Vision4Press platform.
Data correspond to usage on the plateform after 2015. The current usage metrics is available 48-96 hours after online publication and is updated daily on week days.
Initial download of the metrics may take a while.