Fig. 7.
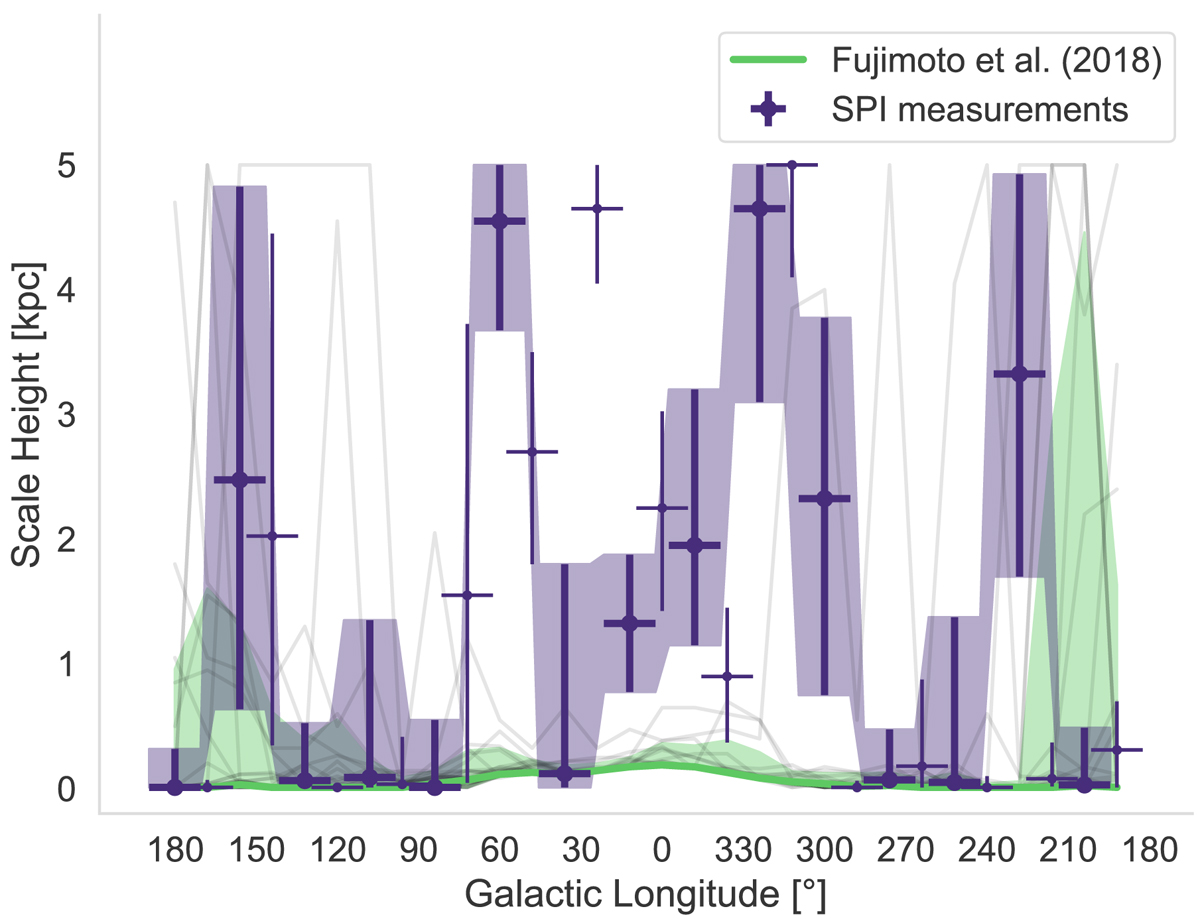
Best fitting scale height for individual 12° longitude bins along galactic plane. The grey lines show the results for all 36 observer positions in the simulation by Fujimoto et al. (2018) individually. Their median is given by the green line with the 68th percentile as shaded green region. The purple crosses represent the maximum likelihood scale heights obtained from SPI data with errors in y-direction depicting the average width of the log(ℒ)-profile in each longitude bin. Since adjacent ROIs are overlapping, data points are shown alternately with bold and thin markers to group mostly-independent data points together. The shaded region follows only the bold data points to guide the eye for a possible trend. The fits are restricted to 5 kpc scale heights.
Current usage metrics show cumulative count of Article Views (full-text article views including HTML views, PDF and ePub downloads, according to the available data) and Abstracts Views on Vision4Press platform.
Data correspond to usage on the plateform after 2015. The current usage metrics is available 48-96 hours after online publication and is updated daily on week days.
Initial download of the metrics may take a while.