Fig. 8
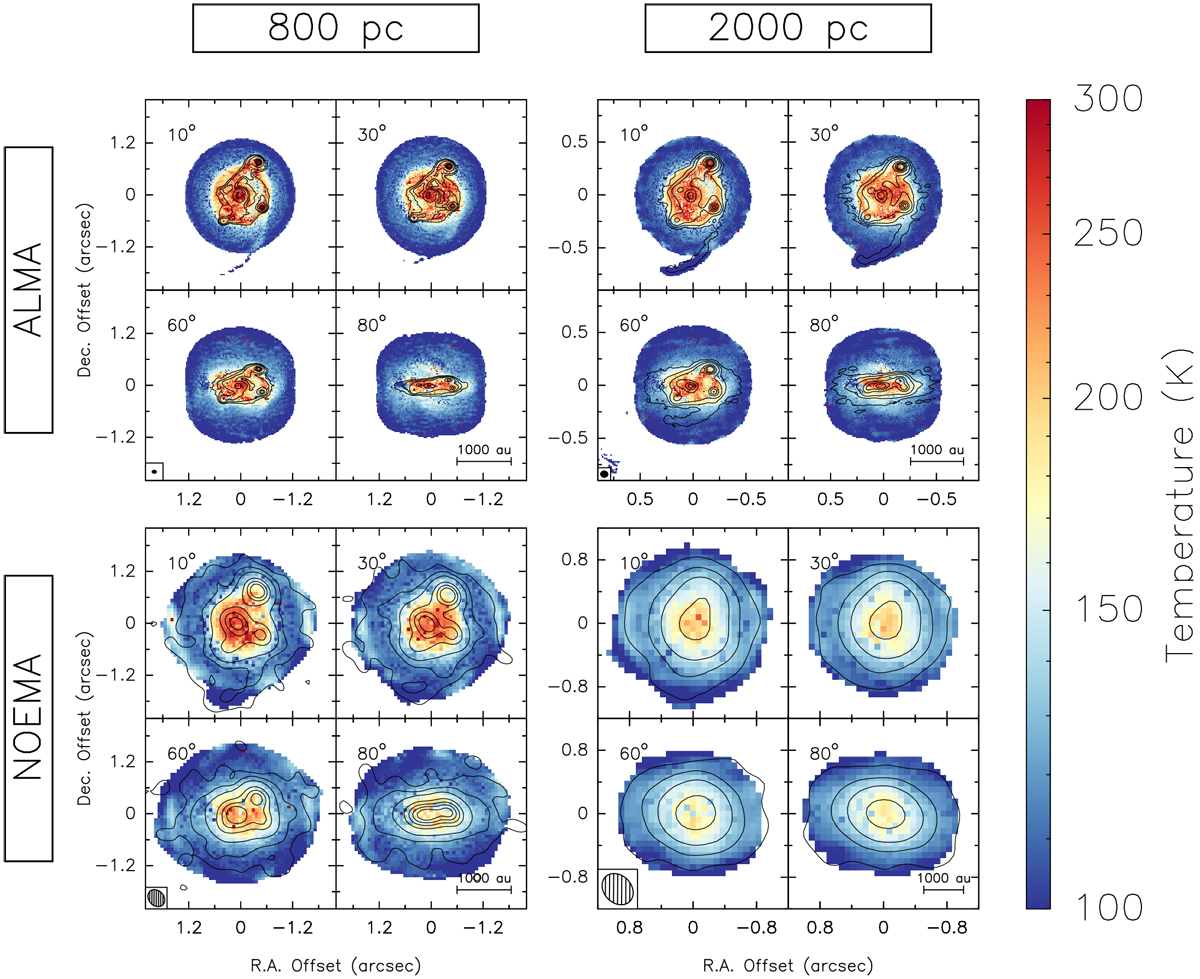
Rotational temperature maps of synthetic ALMA observations (top row) and synthetic NOEMA observations (bottom row,) shifted to a distance of 800 pc (left column) and 2000 pc (right column), obtained by fitting CH3 CN (12K−11K) K = 4−6 lines simultaneously with XCLASS. Each panel contains four sub-panels corresponding to the image inclined by 10° (top left), 30° (top right), 60° (bottom left), and 80° (bottom right). The synthesised beam is shown in the bottom left corner of each set of synthetic observations. The contours correspond to the 1.37 mm continuum shown in Fig. 3. The scale used in the plots is for ease of comparison to the “true” disc mid-plane temperature shown in Fig. 9.
Current usage metrics show cumulative count of Article Views (full-text article views including HTML views, PDF and ePub downloads, according to the available data) and Abstracts Views on Vision4Press platform.
Data correspond to usage on the plateform after 2015. The current usage metrics is available 48-96 hours after online publication and is updated daily on week days.
Initial download of the metrics may take a while.