Fig. 7
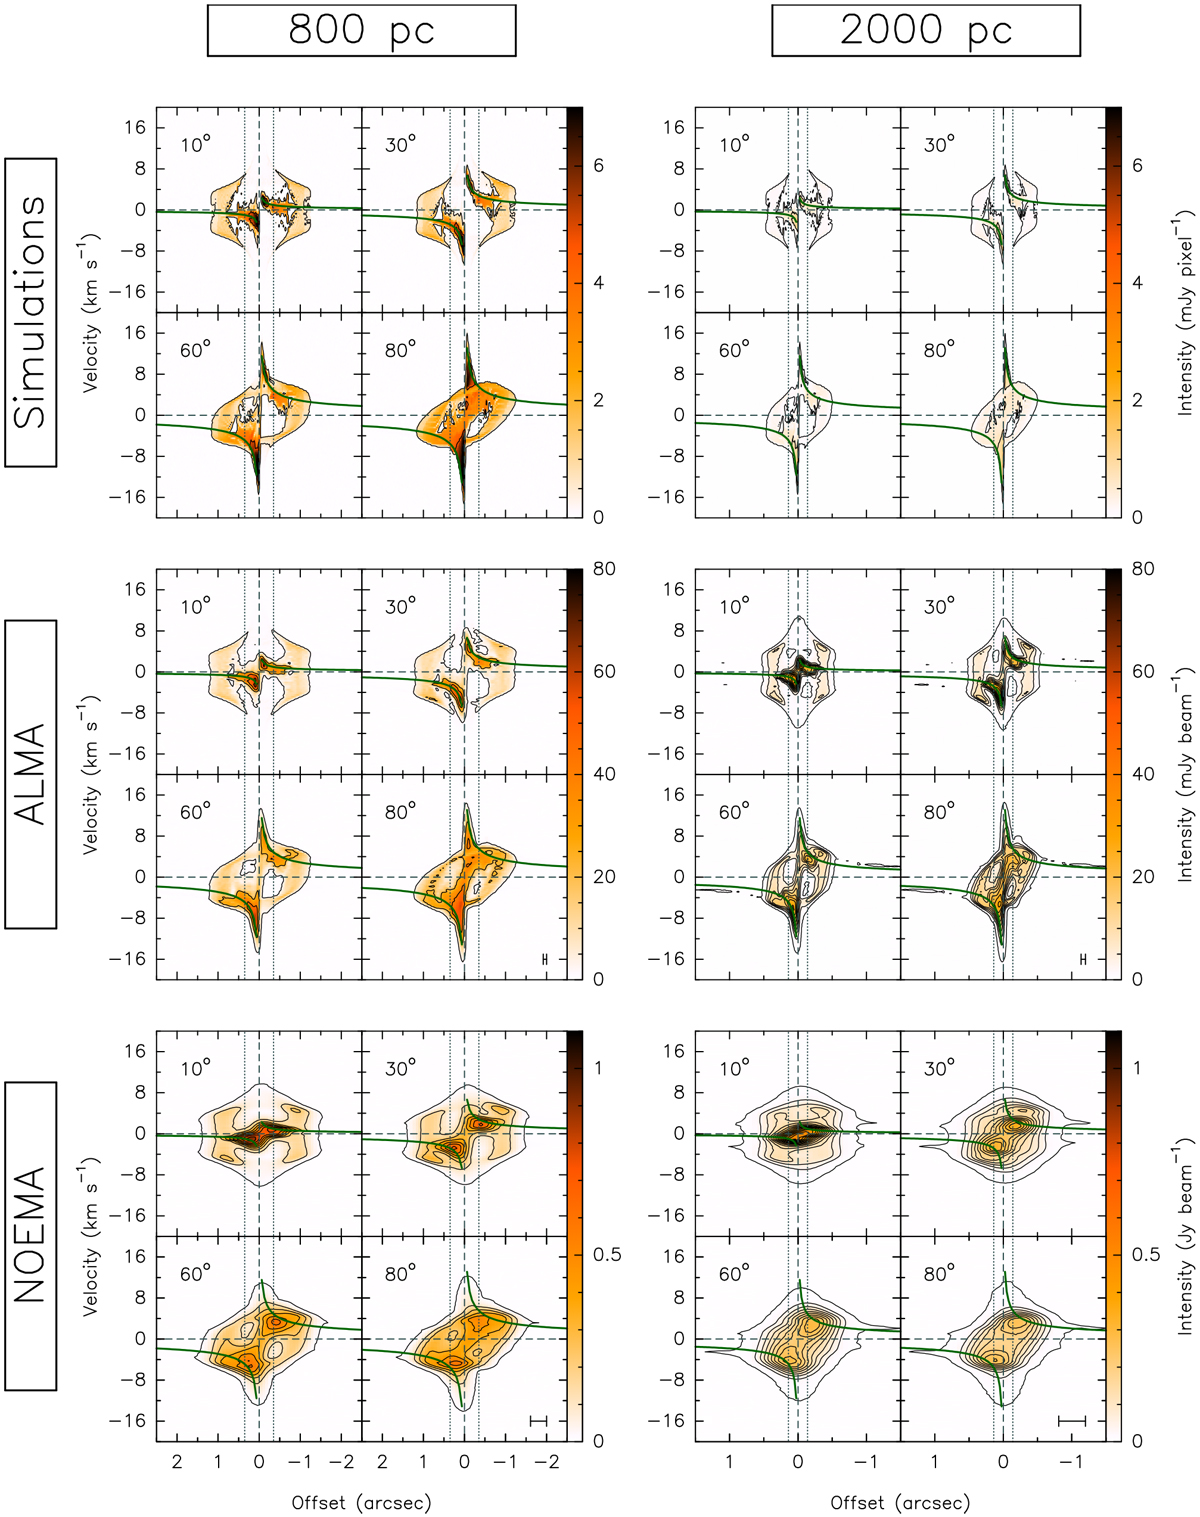
Position–velocity plots of CH3CN (124−114) for a cut in the east–west direction across the model simulations (top row), synthetic ALMA observations (middle row), and synthetic NOEMA observations (bottom row,) shifted to a distance of 800 pc (left column) and 2000 pc (right column). Each panel contains four sub-panels corresponding to the image inclined by 10° (top left), 30° (top right), 60° (bottom left), and 80° (bottom right). The three outermost black contours correspond to the 6, 12, and 18σ levels. The remaining black contours increase in steps of 150σ. The green curves correspond to the region within which emission is expected if the gas is in a disc in Keplerian rotation about a 10 M⊙ star. The colour scale is the same for each row to show the effect of loss of emission with increasing distance. The vertical and horizontal dashed lines correspond to the position of the protostar and zero LSR velocity. The vertical dotted lines correspond to the radii at which the centrifugal barrier is seen (± 250 au). The positionresolution is shown as a scale bar in the bottom right corner of each set of synthetic observations. The velocity resolution is 0.35 km s−1 .
Current usage metrics show cumulative count of Article Views (full-text article views including HTML views, PDF and ePub downloads, according to the available data) and Abstracts Views on Vision4Press platform.
Data correspond to usage on the plateform after 2015. The current usage metrics is available 48-96 hours after online publication and is updated daily on week days.
Initial download of the metrics may take a while.