Fig. 14
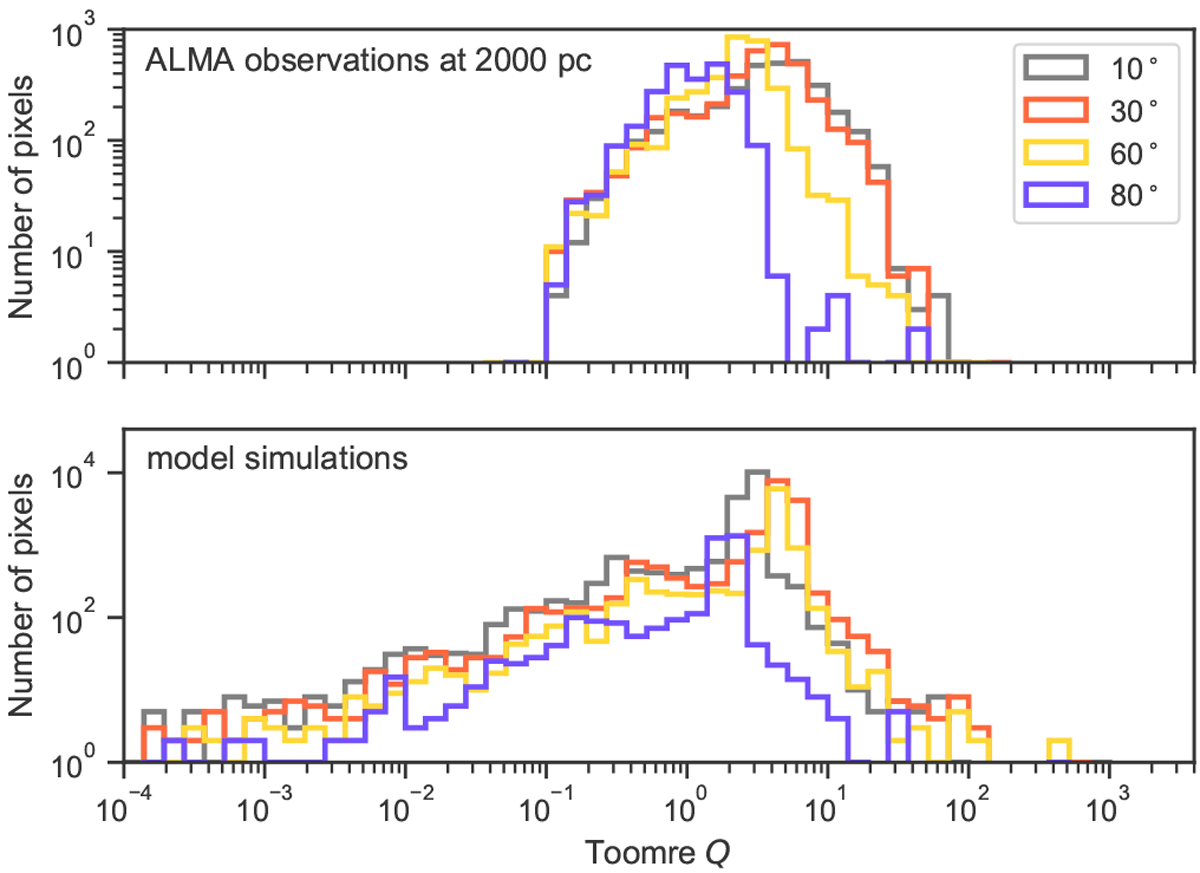
Top: histogram of Q values for synthetic ALMA observations at 2000 pc (see top right panel of Fig. 13), including only pixels that lie within 6σ continuum contours to show the Q distribution mostly associated with the disc rather than the envelope. Bottom: histogram of Q values for model simulations (see Fig. 12), including only pixels within a radius of 1600 au.
Current usage metrics show cumulative count of Article Views (full-text article views including HTML views, PDF and ePub downloads, according to the available data) and Abstracts Views on Vision4Press platform.
Data correspond to usage on the plateform after 2015. The current usage metrics is available 48-96 hours after online publication and is updated daily on week days.
Initial download of the metrics may take a while.