Fig. 13
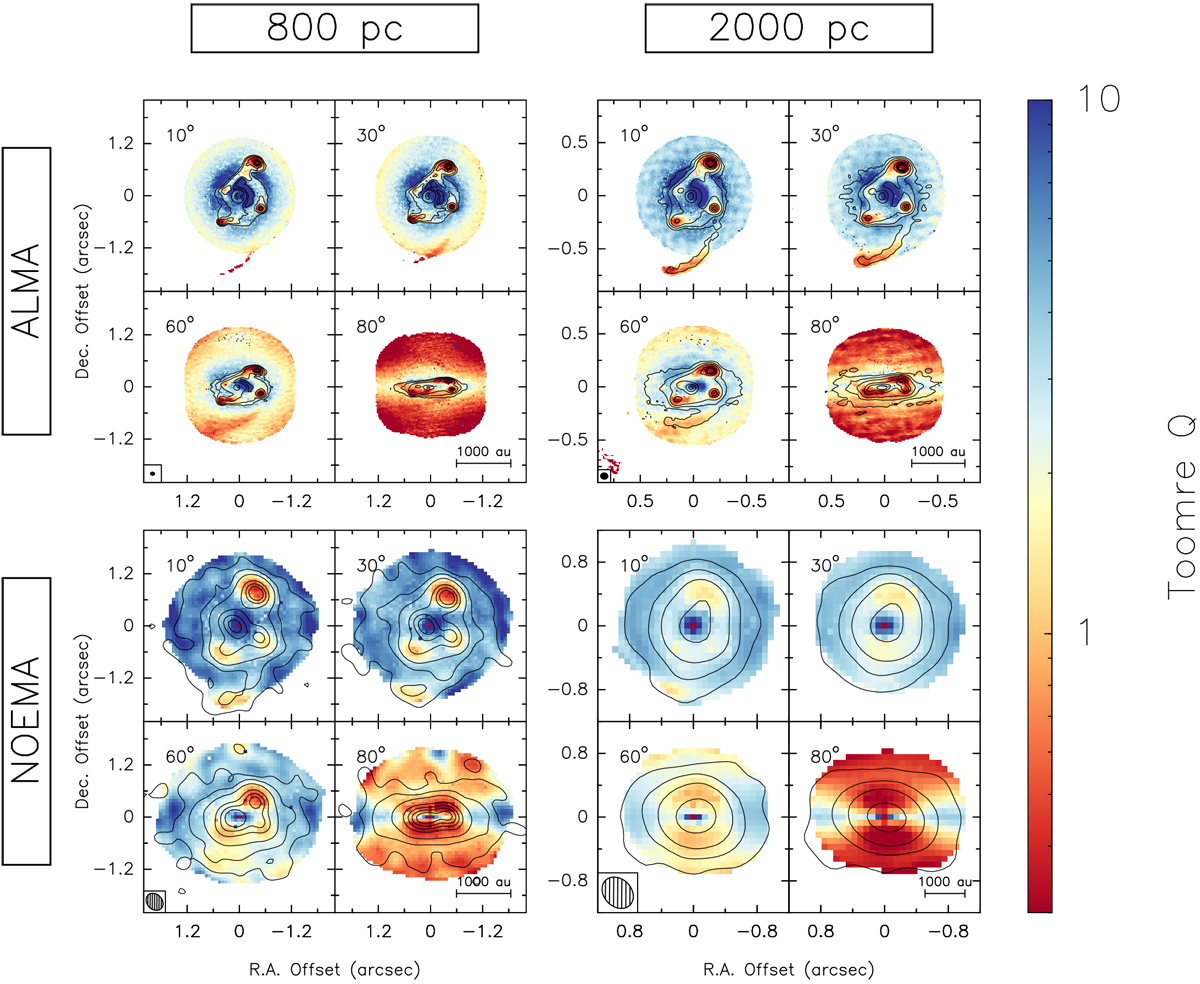
Toomre Q map of synthetic ALMA observations (top row) and synthetic NOEMA observations (bottom row,) shifted to a distance of 800 pc (left column) and 2000 pc (right column). Each panel contains four sub-panels corresponding to the image inclined by 10° (top left), 30° (top right), 60° (bottom left), and 80° (bottom right). In each case, the disc is assumed to be in Keplerian rotation about a 10 M⊙ star at the centre. The angular velocities have been corrected for the inclination (see text). The contours correspond to the 1.37 mm continuum shown in Fig. 3. The synthesised beam is shown in the bottom left corner and a scale bar in the bottom right corner of each set of synthetic observations. Q values of less than 1 correspond to regions unstable against gravitational collapse.
Current usage metrics show cumulative count of Article Views (full-text article views including HTML views, PDF and ePub downloads, according to the available data) and Abstracts Views on Vision4Press platform.
Data correspond to usage on the plateform after 2015. The current usage metrics is available 48-96 hours after online publication and is updated daily on week days.
Initial download of the metrics may take a while.