Fig. 11
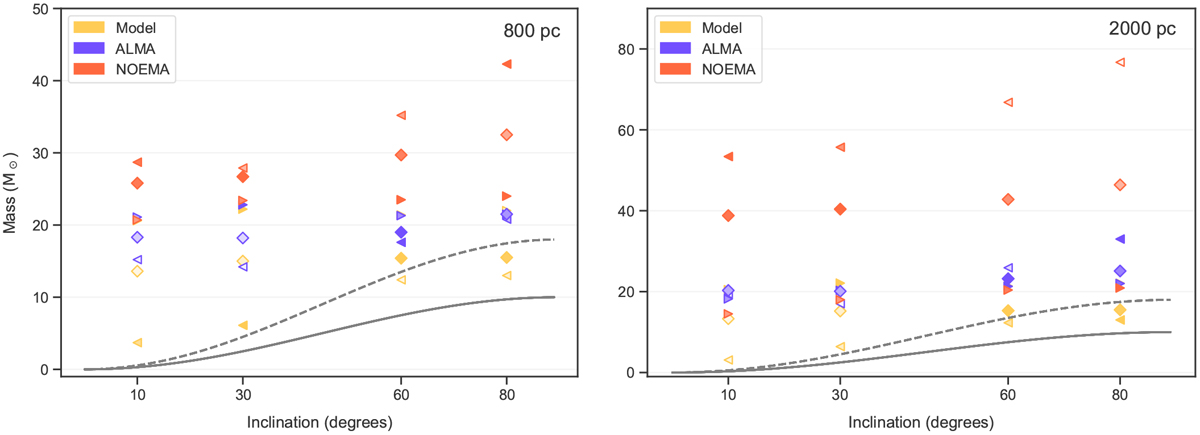
Massestimates from fitting the 6σ edges of the PV diagrams of CH3CN (124−114) shown in Fig. 7 using the method introduced by Seifried et al. (2016) for the model simulations (yellow), ALMA (purple), and NOEMA observations (orange) at 800 pc (left) and 2000 pc (right). The triangles pointing to the left and right correspond to fits to the inner and outer regions, respectively. The diamonds correspond to fits to the entire PV curves. The transparency of the markers correspond to the χ2 value of the fit, weighted by the χ2 value of the best-fit curve for a given region. The more opaque the marker, the better the fit. The solidand dashed grey curves correspond to the true estimate for the mass of the protostar (10 M⊙), and the mass of the protostar + disc (18 M⊙), respectively, corrected by sin2 (i) for each inclination i.
Current usage metrics show cumulative count of Article Views (full-text article views including HTML views, PDF and ePub downloads, according to the available data) and Abstracts Views on Vision4Press platform.
Data correspond to usage on the plateform after 2015. The current usage metrics is available 48-96 hours after online publication and is updated daily on week days.
Initial download of the metrics may take a while.