Fig. 8.
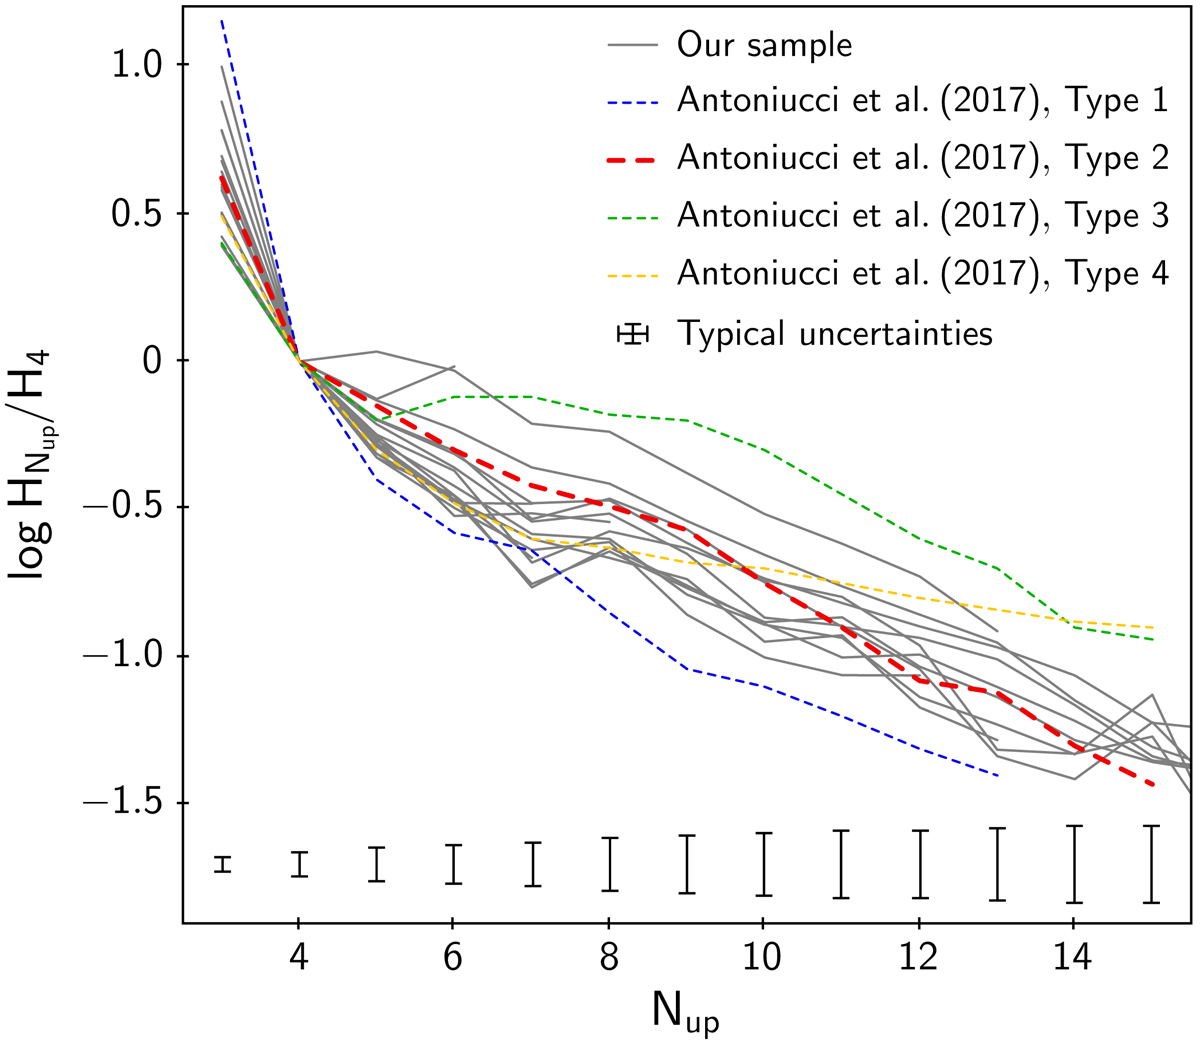
Shapes of Balmer decrements computed for each of our targets (gray lines), defined as logHn/H4 (≡logHn/Hβ). The prototypes of Balmer decrement types identified in Lupus by Antoniucci et al. (2017) are shown with dotted lines for comparison; a thicker stroke is used to emphasize Type 2 (the most common type in their sample and in ours). Typical uncertainties on the log HNup/H4, displayed below the individual Balmer decrement trends, were calculated from the uncertainties associated with the corresponding line flux measurements.
Current usage metrics show cumulative count of Article Views (full-text article views including HTML views, PDF and ePub downloads, according to the available data) and Abstracts Views on Vision4Press platform.
Data correspond to usage on the plateform after 2015. The current usage metrics is available 48-96 hours after online publication and is updated daily on week days.
Initial download of the metrics may take a while.