Fig. 6.
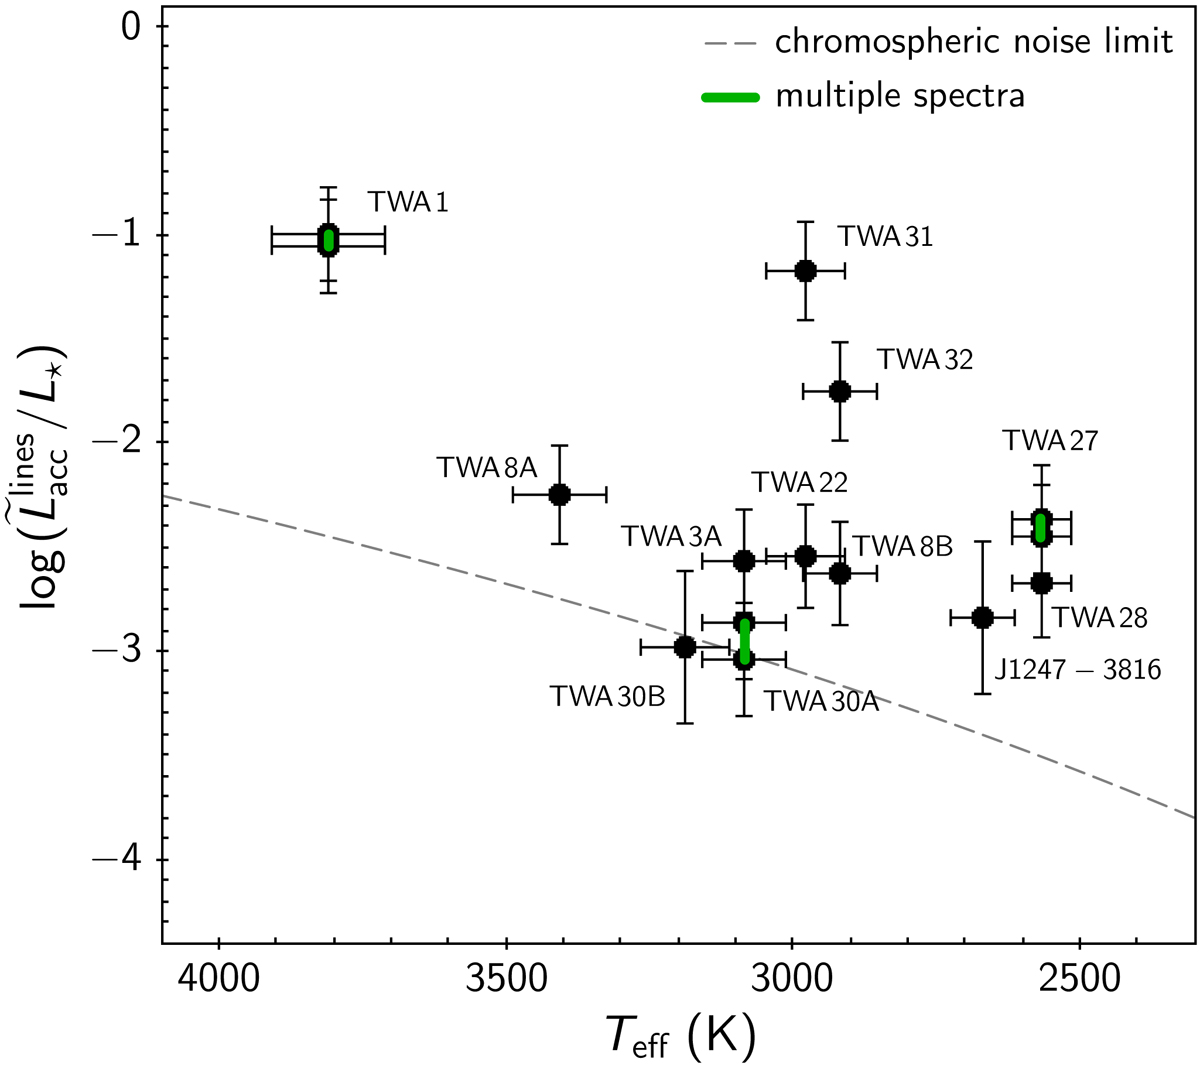
Logarithmic ratio between median Lacc measured from Lline (see text) and stellar L⋆, as a function of Teff. Green vertical lines connect multiple measurements obtained for objects with more than one spectrum. The gray dashed line indicates the emission level below which the impact of chromospheric emission on the observed accretion signatures becomes dominant.
Current usage metrics show cumulative count of Article Views (full-text article views including HTML views, PDF and ePub downloads, according to the available data) and Abstracts Views on Vision4Press platform.
Data correspond to usage on the plateform after 2015. The current usage metrics is available 48-96 hours after online publication and is updated daily on week days.
Initial download of the metrics may take a while.