Fig. 5.
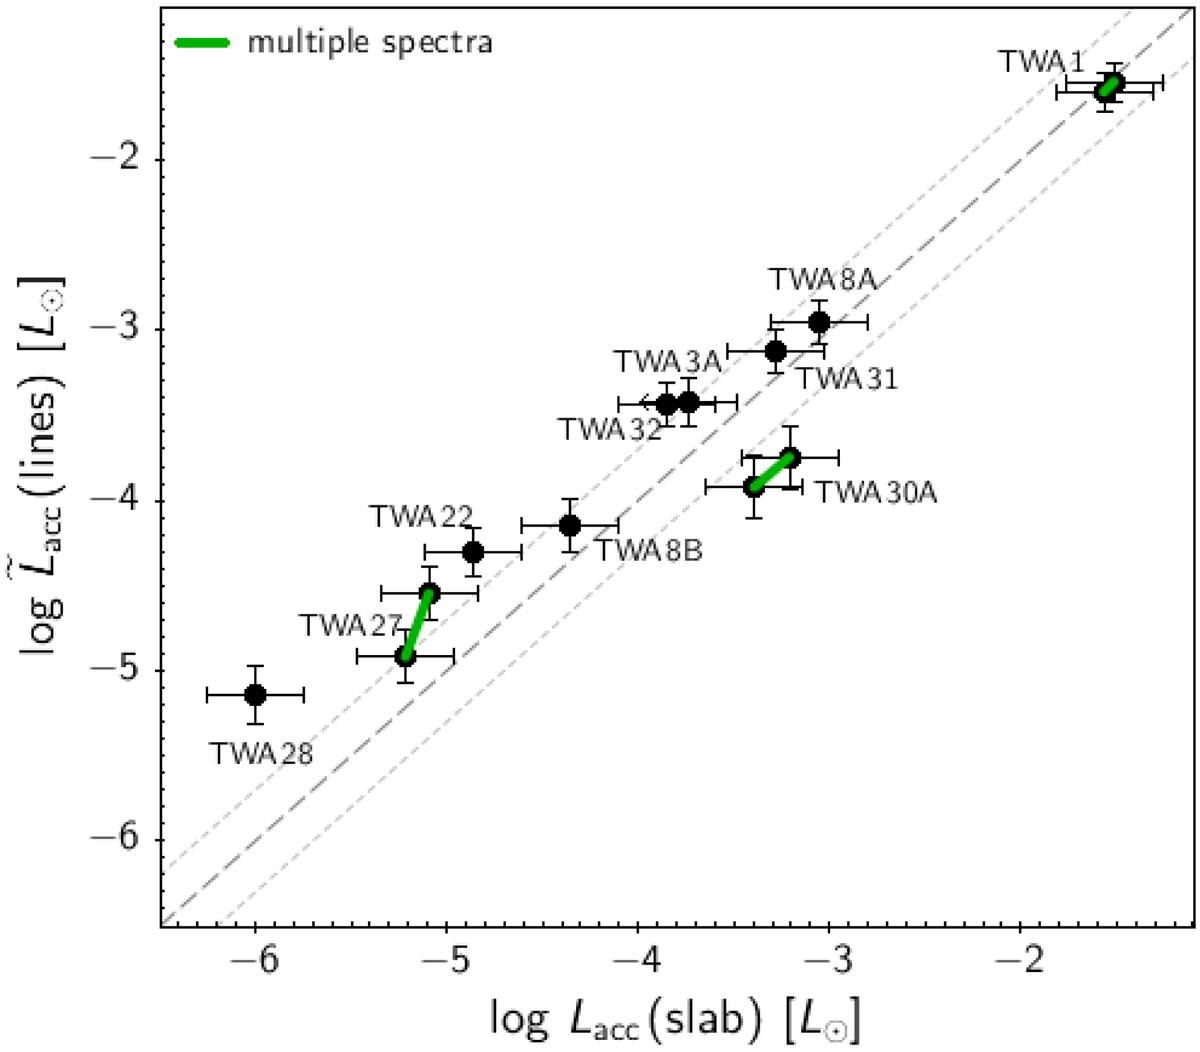
Comparison between log Lacc values measured from excess continuum–fitting with slab emission models (Sect. 3.1.1), and values derived from emission line luminosity (Lline) measurements, using empirical Lline − Lacc calibration relationships from Alcalá et al. (2014). Error bars on the x-axis correspond to a typical uncertainty of 0.25 dex on the Lacc measurements from the multicomponent spectral fit; error bars on the y-axis follow from error propagation including uncertainties on the measured line fluxes, and uncertainties on the calibration relationships, as listed in Alcalá et al. (2014). Green lines connect multiple measurements for the same object. Light dotted lines delimit an area of ±0.3 dex around the equality line (dashed in gray on the diagram).
Current usage metrics show cumulative count of Article Views (full-text article views including HTML views, PDF and ePub downloads, according to the available data) and Abstracts Views on Vision4Press platform.
Data correspond to usage on the plateform after 2015. The current usage metrics is available 48-96 hours after online publication and is updated daily on week days.
Initial download of the metrics may take a while.