Fig. 4.
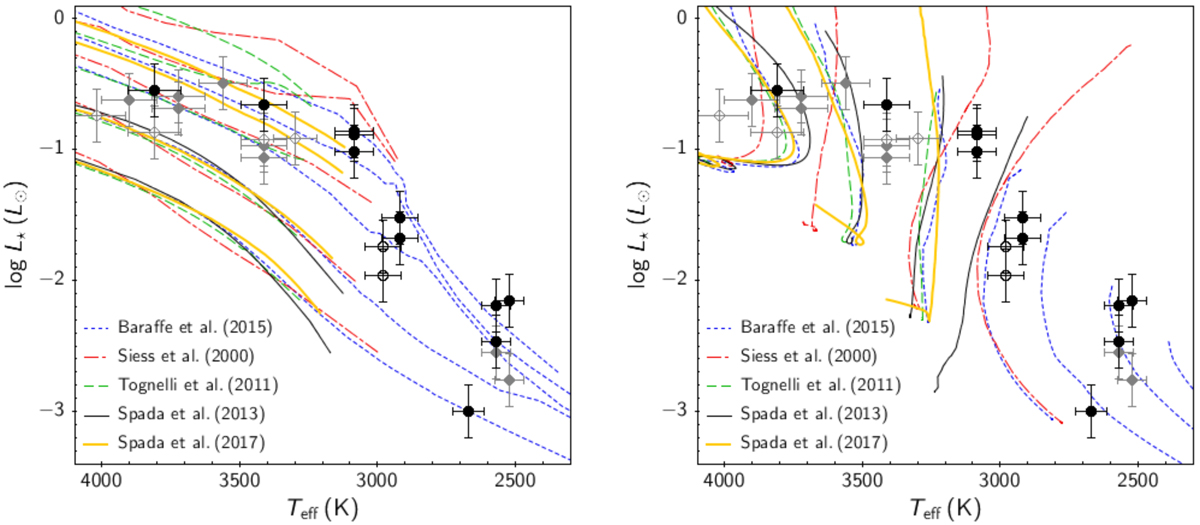
HR diagram for stars in Table 2 (black dots) compared with disk–free TWA objects investigated in Manara et al. (2013b) and Stelzer et al. (2013) (gray diamonds), rescaled to Gaia DR2 distances and Herczeg & Hillenbrand’s (2014) SpT–based Teff. Filled symbols identify probable TWA members, open symbols targets with disputed membership. Errors on Teff and log L⋆ are as in Fig. 3 (y-axis) and Fig. 2 (x-axis), respectively. Left panel: theoretical isochrones from different model grids (Baraffe et al. 2015, dotted blue line; Siess et al. 2000, dash-dot red line; Tognelli et al. 2011, dashed green line; Spada et al. 2013, solid black line; Spada et al. 2017, solid yellow line) are shown for comparison on the diagram. The illustrated isochrone ages are, from top to bottom, 1 Myr, 2 Myr, 5 Myr, 20 Myr, and 100 Myr (the isochrones at 1, 2, and 5 Myr are not available from the models of Spada et al. 2013, and the 5 Myr isochrone is not available from the models of Spada et al. 2017). Right panel: mass tracks from the same model grids are illustrated for comparison. Displayed masses are, from right to left: 0.01 M⊙, 0.02 M⊙, 0.05 M⊙, 0.1 M⊙, 0.2 M⊙, 0.4 M⊙, and 0.6 M⊙ (Baraffe et al. 2015); 0.1 M⊙, 0.2 M⊙, 0.4 M⊙, 0.6 M⊙ (Siess et al. 2000; Spada et al. 2013); 0.2 M⊙, 0.4 M⊙, 0.6 M⊙ (Tognelli et al. 2011; Spada et al. 2017).
Current usage metrics show cumulative count of Article Views (full-text article views including HTML views, PDF and ePub downloads, according to the available data) and Abstracts Views on Vision4Press platform.
Data correspond to usage on the plateform after 2015. The current usage metrics is available 48-96 hours after online publication and is updated daily on week days.
Initial download of the metrics may take a while.