Fig. 2.
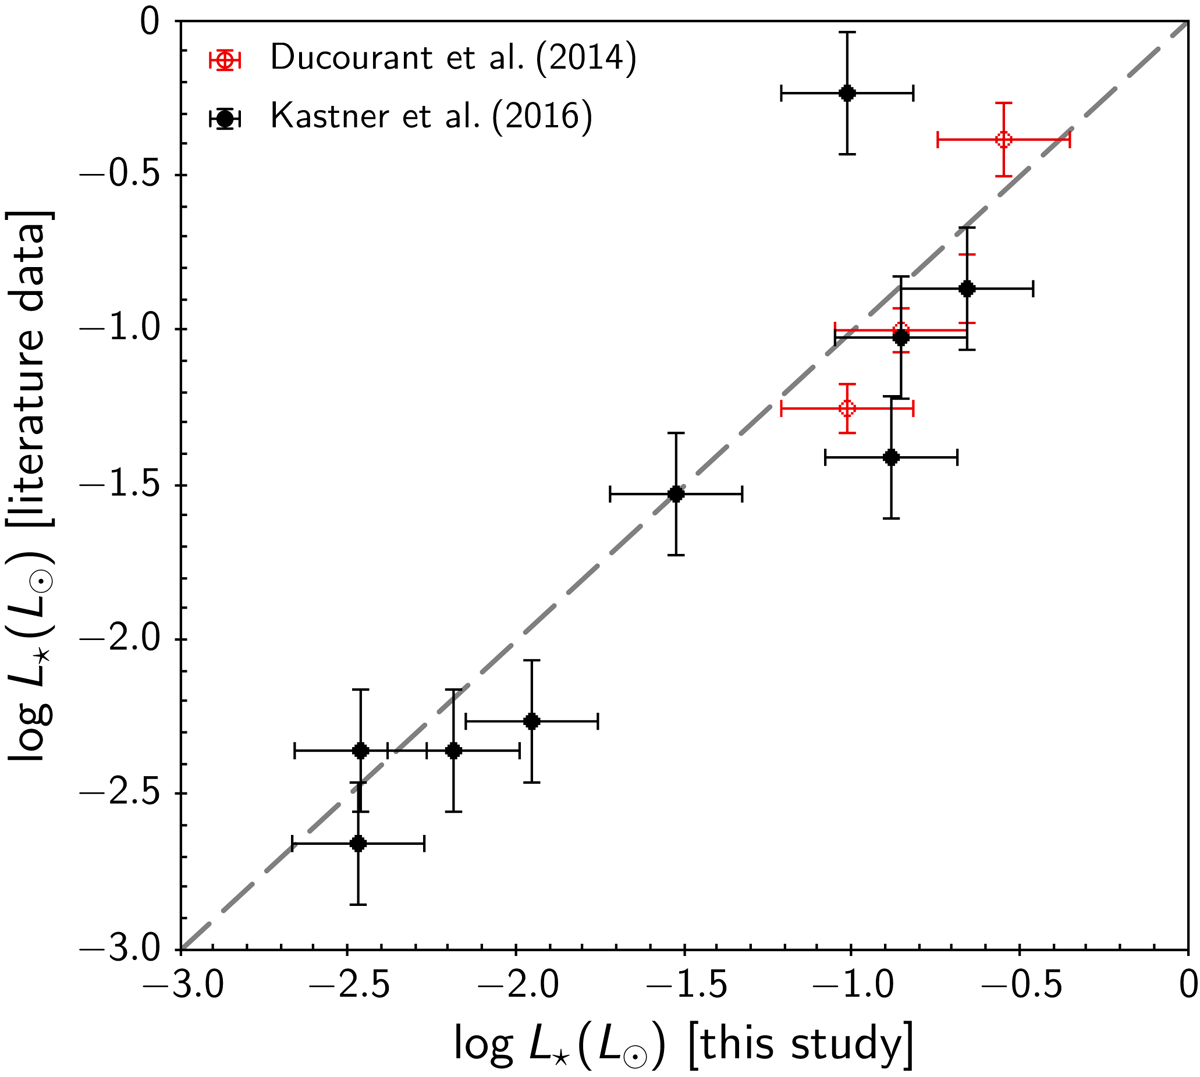
Comparison between our L⋆ estimates (see Sect. 3.1.1 and Table 2) and values reported by Ducourant et al. (2014, red symbols) and Kastner et al. (2016, black symbols), corrected for difference in distance between our adopted values and values listed in those references for individual objects. The error bars trace the individual uncertainties associated with the L⋆ values in the compilation of Ducourant et al. (2014), and a typical uncertainty of ±0.2 dex in the other cases, for illustration purposes. The identity line is dashed in gray to guide the eye.
Current usage metrics show cumulative count of Article Views (full-text article views including HTML views, PDF and ePub downloads, according to the available data) and Abstracts Views on Vision4Press platform.
Data correspond to usage on the plateform after 2015. The current usage metrics is available 48-96 hours after online publication and is updated daily on week days.
Initial download of the metrics may take a while.