Free Access
Fig. F.1.
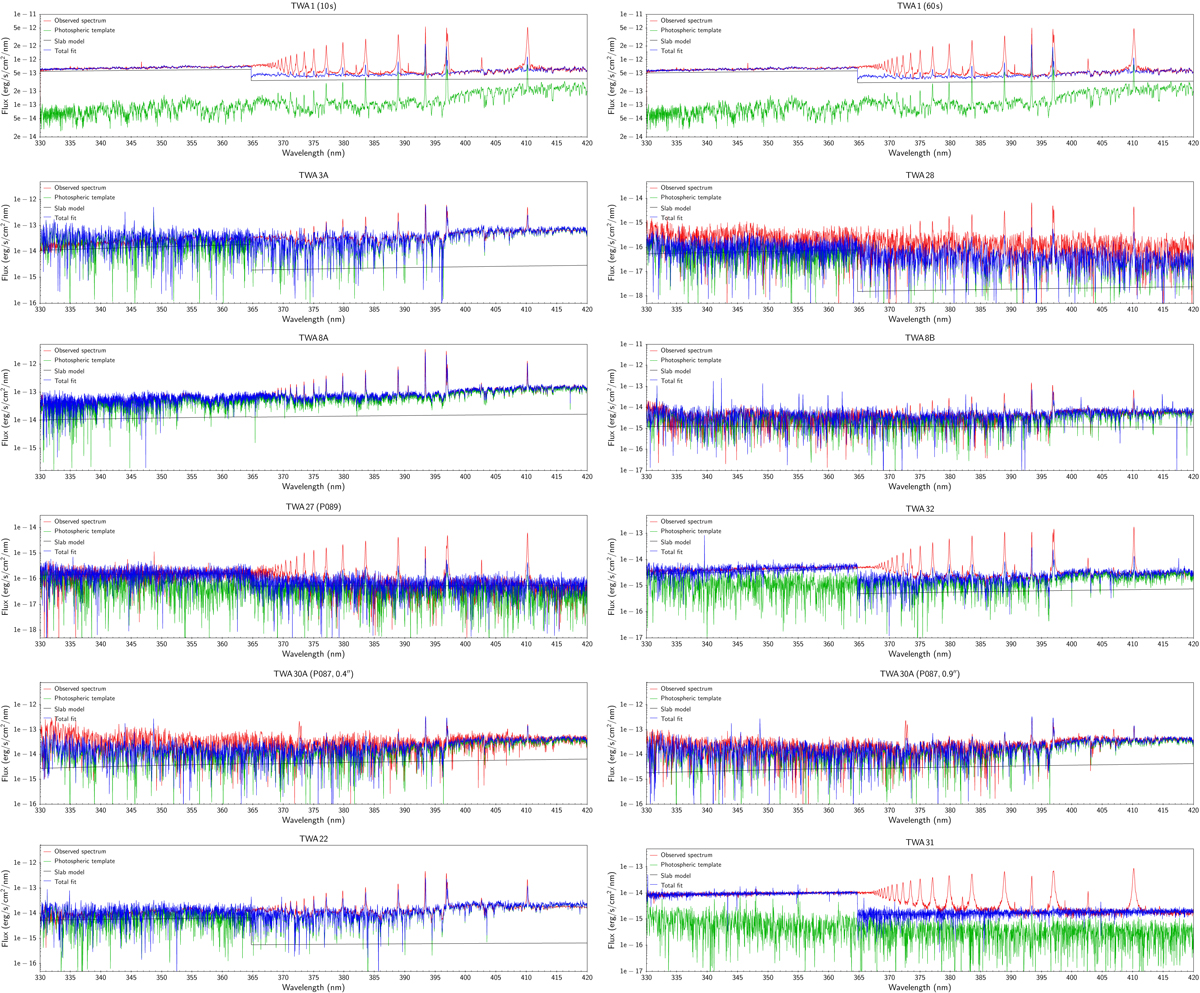
Results of the multicomponent fit to the observed spectra of our targets (red) around the Balmer jump region. The best-fit photospheric template is illustrated in green, the continuum emission from the hydrogen slab is shown in black, and the total fit is traced in blue.
Current usage metrics show cumulative count of Article Views (full-text article views including HTML views, PDF and ePub downloads, according to the available data) and Abstracts Views on Vision4Press platform.
Data correspond to usage on the plateform after 2015. The current usage metrics is available 48-96 hours after online publication and is updated daily on week days.
Initial download of the metrics may take a while.