Free Access
Fig. E.1.
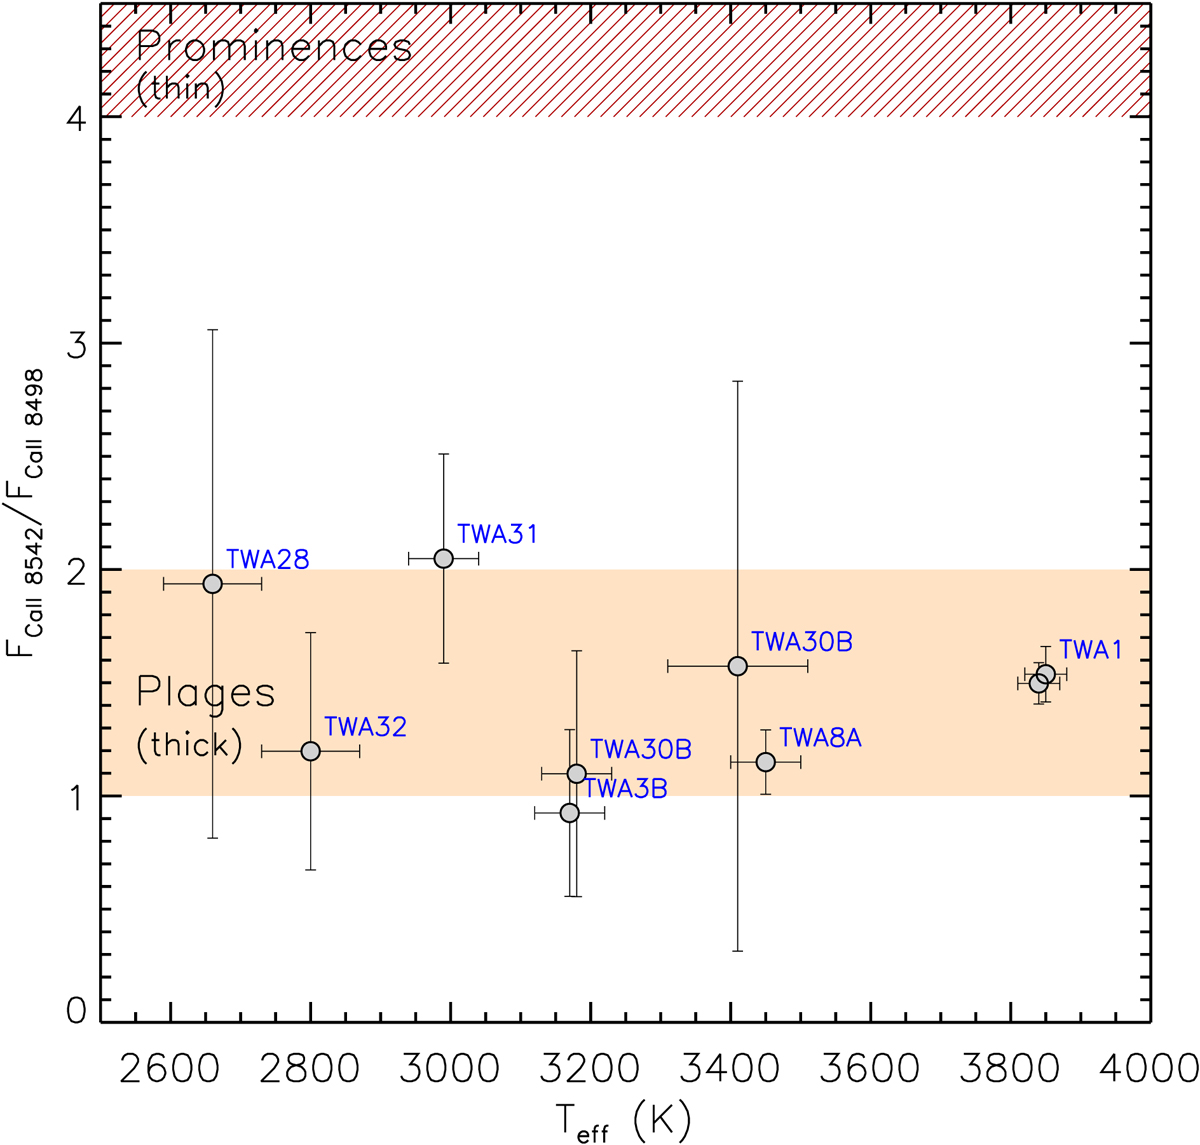
FCa II 8542/FCa II 8498 ratio measured for TWA targets with detected Ca II IRT emission, as a function of stellar Teff. The range of values typical for solar plages and prominences are marked as a filled strip and a cross-hatched strip, respectively, for comparison purposes.
Current usage metrics show cumulative count of Article Views (full-text article views including HTML views, PDF and ePub downloads, according to the available data) and Abstracts Views on Vision4Press platform.
Data correspond to usage on the plateform after 2015. The current usage metrics is available 48-96 hours after online publication and is updated daily on week days.
Initial download of the metrics may take a while.