Fig. D.1.
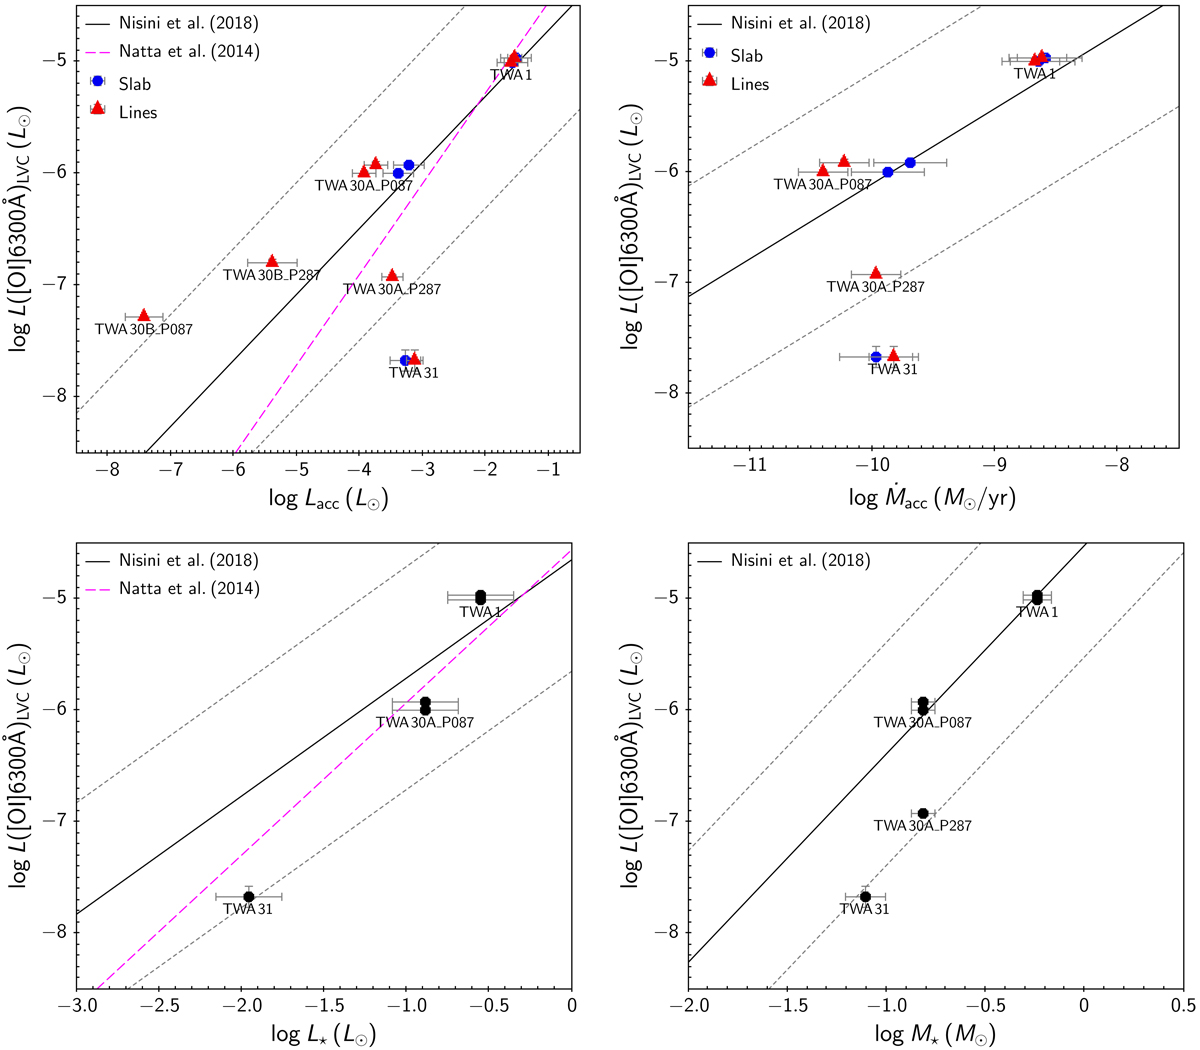
Logarithmic luminosity of [O I] 6300 Å LVC as a function of log Lacc (upper left panel), log Ṁacc (upper right panel), log L⋆ (lower left panel), and log M⋆ (lower right panel) for stars with detected forbidden line emission in our sample (labeled on each plot). In the upper panels, accretion parameters derived from the Balmer continuum diagnostics (see Sect. 3.1.1) are marked as blue dots, while those derived from the luminosity of emission lines (see Sect. 3.2.1) are marked as red triangles. On each panel, the correlation relationship between the relevant quantities derived by Nisini et al. (2018) is traced as a solid black line, while dotted gray lines mark a range of ±1 dex around the calibration (which corresponds to the vertical spread of points observed on the corresponding diagrams in Nisini et al. 2018). The correlation trends obtained by Natta et al. (2014) are also shown as dashed magenta lines for comparison (left panels).
Current usage metrics show cumulative count of Article Views (full-text article views including HTML views, PDF and ePub downloads, according to the available data) and Abstracts Views on Vision4Press platform.
Data correspond to usage on the plateform after 2015. The current usage metrics is available 48-96 hours after online publication and is updated daily on week days.
Initial download of the metrics may take a while.