Fig. C.1.
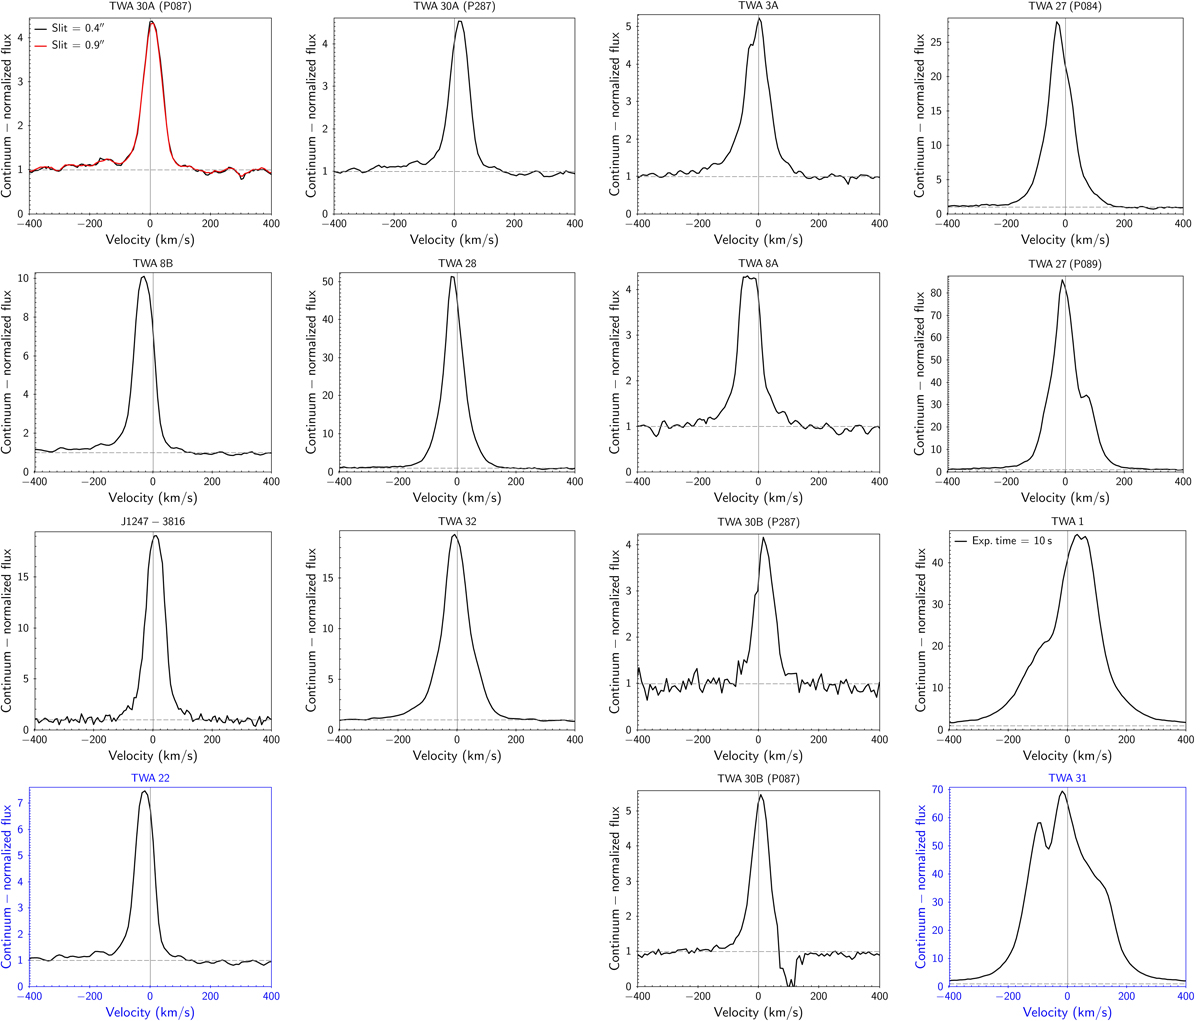
Hα line profiles for all objects in Table 1, except TWA 3B (which does not exhibit signatures of a disk up to 10 μm) and TWA 40 (for which no line emission was detected). The profiles are sorted according to their qualitative classification following Reipurth et al.’s (1996) scheme: Type I (first and second columns from the left), Type III (first three panels from the top in the third column from the left), Type II/III (last column from the left), Type IV (last panel from the top in the third column). Blue frames are adopted for the Hα profiles of disputed members TWA 22 and TWA 31. Only the Hα profile of the spectrum obtained with lower integration time is shown for TWA 1, because the other spectrum is likely saturated in Hα. When multiple spectra were acquired for the same star at different observing epochs (TWA 27, TWA 30A, TWA 30B), the corresponding Hα profiles are illustrated in separate panels.
Current usage metrics show cumulative count of Article Views (full-text article views including HTML views, PDF and ePub downloads, according to the available data) and Abstracts Views on Vision4Press platform.
Data correspond to usage on the plateform after 2015. The current usage metrics is available 48-96 hours after online publication and is updated daily on week days.
Initial download of the metrics may take a while.