Fig. 12.
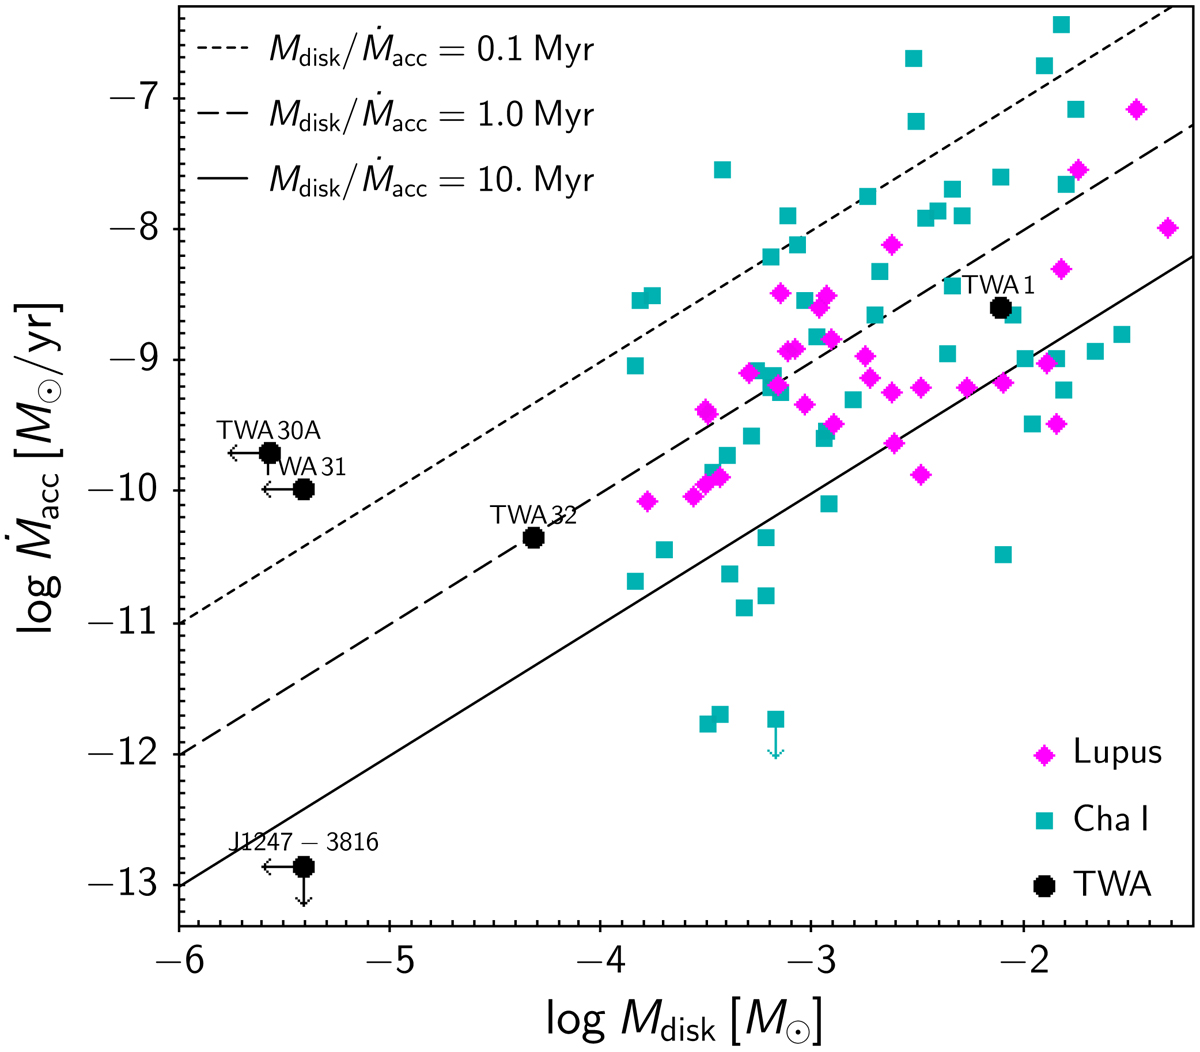
Logarithmic Ṁacc vs. disk mass distribution for stars in the TWA, compared to the populations of the Lupus and Chamaeleon I star-forming regions. The straight lines mark the Ṁacc − Mdisk relationship predicted for different stellar ages in a scenario of viscous quasi-steady disk evolution (Rosotti et al. 2017). Upper limits are indicated by correspondingly oriented arrows.
Current usage metrics show cumulative count of Article Views (full-text article views including HTML views, PDF and ePub downloads, according to the available data) and Abstracts Views on Vision4Press platform.
Data correspond to usage on the plateform after 2015. The current usage metrics is available 48-96 hours after online publication and is updated daily on week days.
Initial download of the metrics may take a while.