Open Access
Fig. 7.
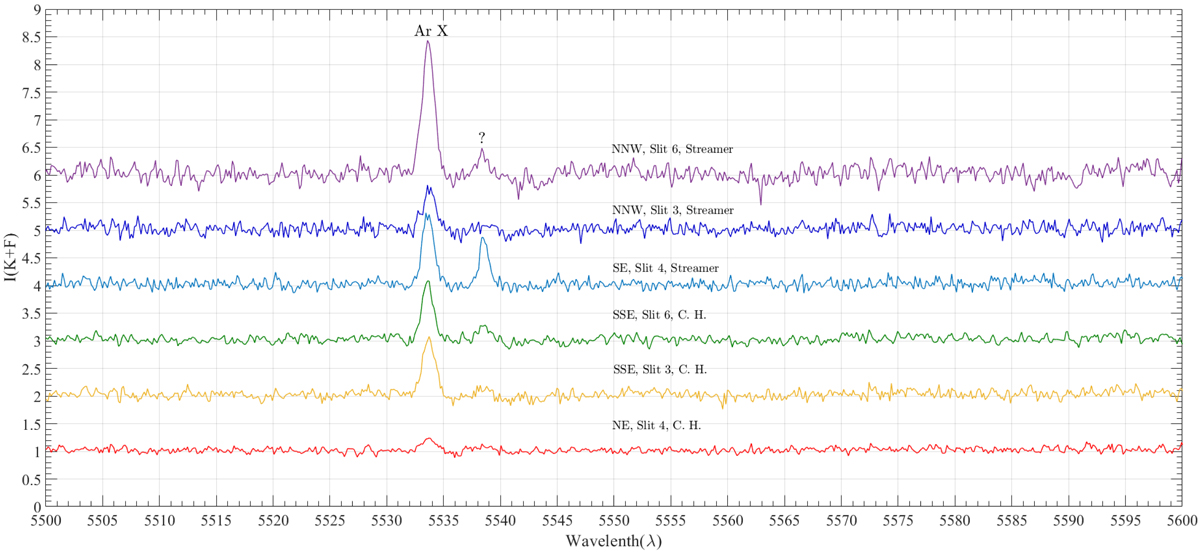
Selected part of our summed spectra in inner corona at different positions around Sun (see Fig. 3) to show intensity variation of new lines. Intensity is shown with a linear scale, with spectra shifted in the ordinate.
Current usage metrics show cumulative count of Article Views (full-text article views including HTML views, PDF and ePub downloads, according to the available data) and Abstracts Views on Vision4Press platform.
Data correspond to usage on the plateform after 2015. The current usage metrics is available 48-96 hours after online publication and is updated daily on week days.
Initial download of the metrics may take a while.