Fig. 5.
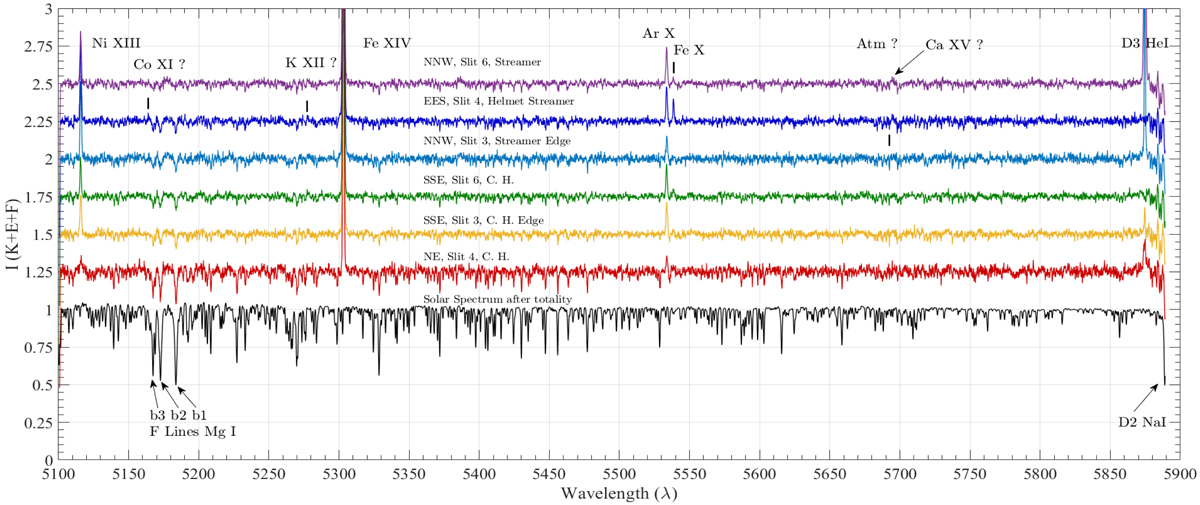
Full averaged K, F, and E corona spectra (on linear scale) for different regions after removing large scale spectral variations. A constant shift was introduced to make the comparison possible among the different regions. On the right-hand side, the strong D3 line of He I was recorded at the end of totality (C3 contact, position 6 at NNW) due to the slit crossing a small prominence.
Current usage metrics show cumulative count of Article Views (full-text article views including HTML views, PDF and ePub downloads, according to the available data) and Abstracts Views on Vision4Press platform.
Data correspond to usage on the plateform after 2015. The current usage metrics is available 48-96 hours after online publication and is updated daily on week days.
Initial download of the metrics may take a while.