Fig. 4.
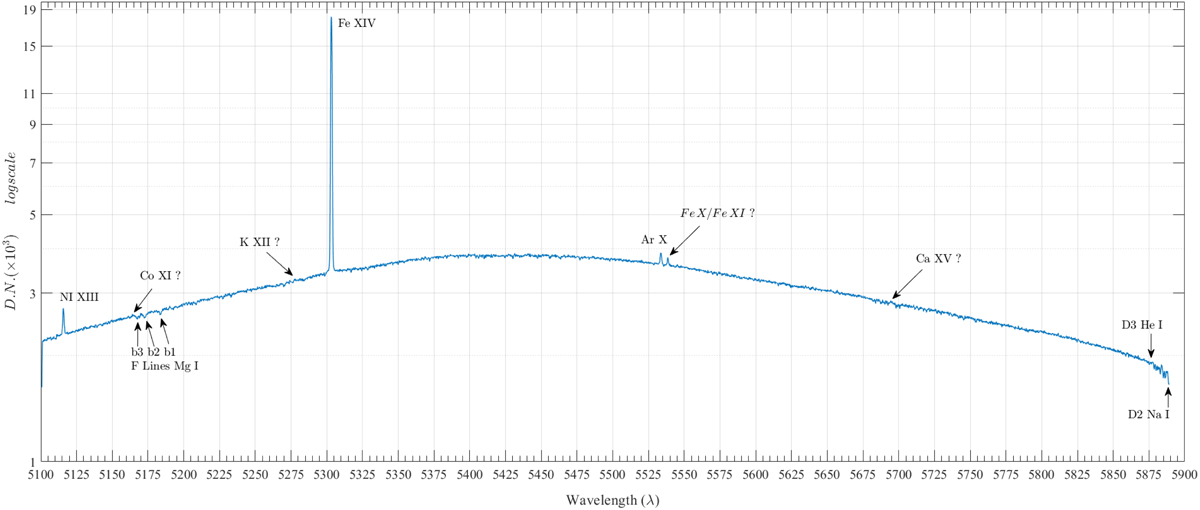
Summed spectra made at position 4 (see Fig. 3) that uses brightest part close to east equatorial region of corona. It shows the variation resulting from the spectral transmittance of the system and the typical behavior of the resulting spectra. It includes the signatures of the lines of the F-corona superposed on the K-corona continuum. The dark noise level and the offset are removed as well as the tiny distortion with respect to the chip. The whole spectrum corresponds to 5616 px along the wavelength axis.
Current usage metrics show cumulative count of Article Views (full-text article views including HTML views, PDF and ePub downloads, according to the available data) and Abstracts Views on Vision4Press platform.
Data correspond to usage on the plateform after 2015. The current usage metrics is available 48-96 hours after online publication and is updated daily on week days.
Initial download of the metrics may take a while.