Fig. 3.
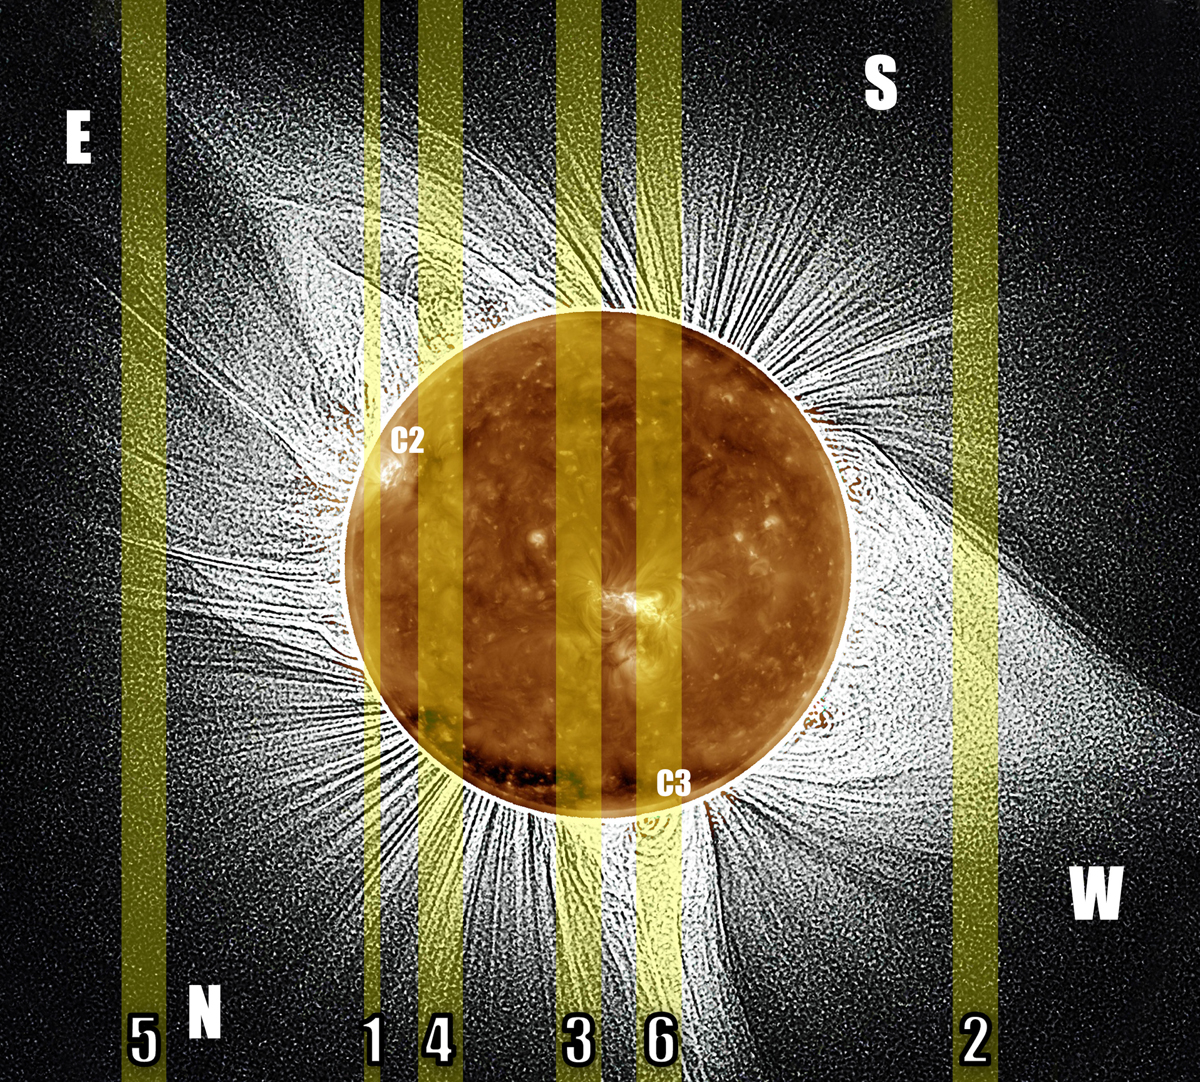
W-L coronal structures obtained from highly processed images by J. Mouette, combined with AIA/SDO 19.4 nm simultaneous image inserted with correct scaling. Yellow vertical bands show the regions covered by the different positions of the entrance slit during totality, including the scanning transverse to the slit that corresponds to the diurnal motion during the burst of 10 spectra taken at each successive position 2, 3, 4, 5, and 6. Position 1 was used to obtain fast spectra (0.1 s exposure time) in the region of the C2 contact, see Fig. 1. The orientations correspond to a reversed image of the corona seen in the sky. The unprocessed image shows a large radial gradient with very bright inner parts, which mask the detail of the image shown on the right-hand side of Fig. 2.
Current usage metrics show cumulative count of Article Views (full-text article views including HTML views, PDF and ePub downloads, according to the available data) and Abstracts Views on Vision4Press platform.
Data correspond to usage on the plateform after 2015. The current usage metrics is available 48-96 hours after online publication and is updated daily on week days.
Initial download of the metrics may take a while.