Fig. 2.
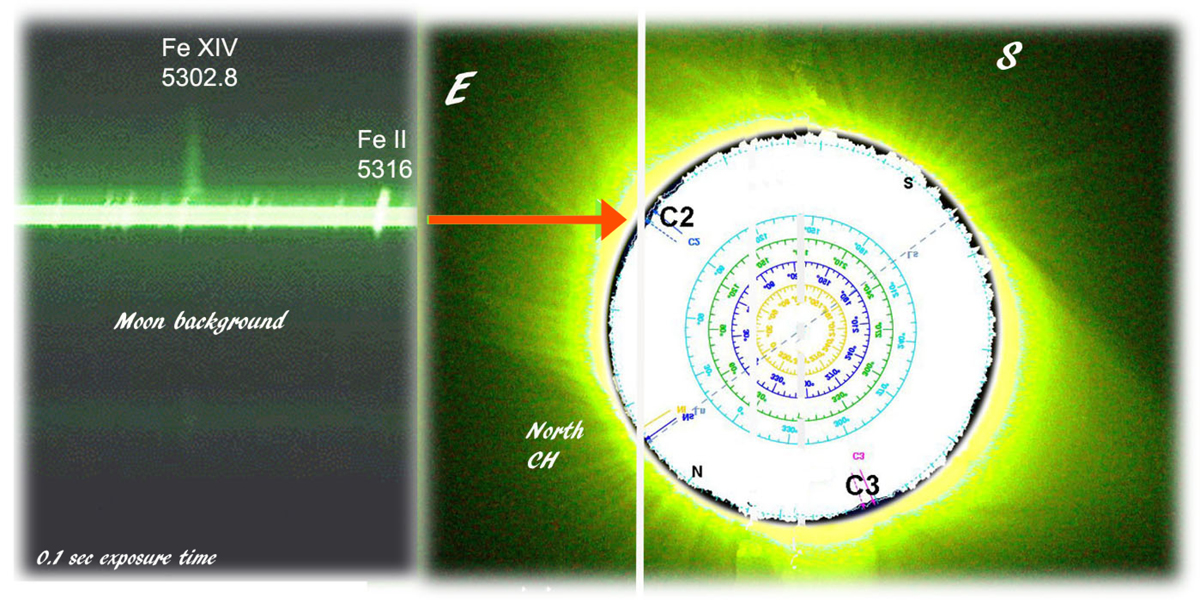
On left, image of selected part (1/35 of spectrum is shown) of single short exposure spectrum taken during C2 contact, with vertical slit position shown at right over unprocessed W-L image taken at same time with green filter; Jubier’s diagram of edge of Moon is overlaid (see http://xjubier.free.fr/en/site_pages/SolarEclipseCalc_Diagram.html); amplitudes of limb lunar features are amplified by factor 80 and width of slit is not to scale. The C2 full spectrum shows hundreds of faint low excitation emission lines formed in the minimum temperature region (see Bazin 2013) often with a low FIP line, such as the bright Fe II line shown on the right of the partial spectrum. In the blue wing of the Fe XIV coronal line (on the left), rising above the local edge of the Moon, the weak Fe I solar line is seen in emission instead of being in absorption, confirming the quality of our spectra. The F-component, which is fainter than the bright K-corona in the near equatorial regions, is not shown.
Current usage metrics show cumulative count of Article Views (full-text article views including HTML views, PDF and ePub downloads, according to the available data) and Abstracts Views on Vision4Press platform.
Data correspond to usage on the plateform after 2015. The current usage metrics is available 48-96 hours after online publication and is updated daily on week days.
Initial download of the metrics may take a while.