Open Access
Fig. A.7.
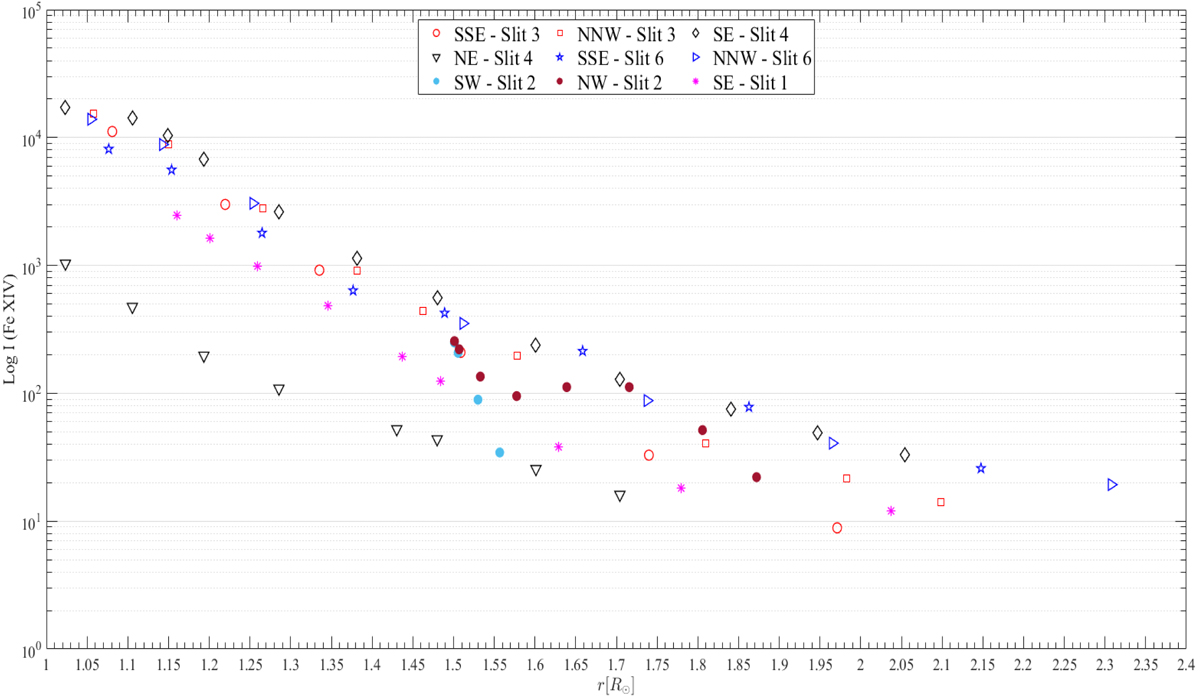
Intensity variation of Fe XIV line for different positions in corona and radial distances. The log scale covers three decades of intensity variations measured above the local K and F background. The line is measured well everywhere, including the deep CH region of position 4 in Fig. 3.
Current usage metrics show cumulative count of Article Views (full-text article views including HTML views, PDF and ePub downloads, according to the available data) and Abstracts Views on Vision4Press platform.
Data correspond to usage on the plateform after 2015. The current usage metrics is available 48-96 hours after online publication and is updated daily on week days.
Initial download of the metrics may take a while.