Fig. 3.
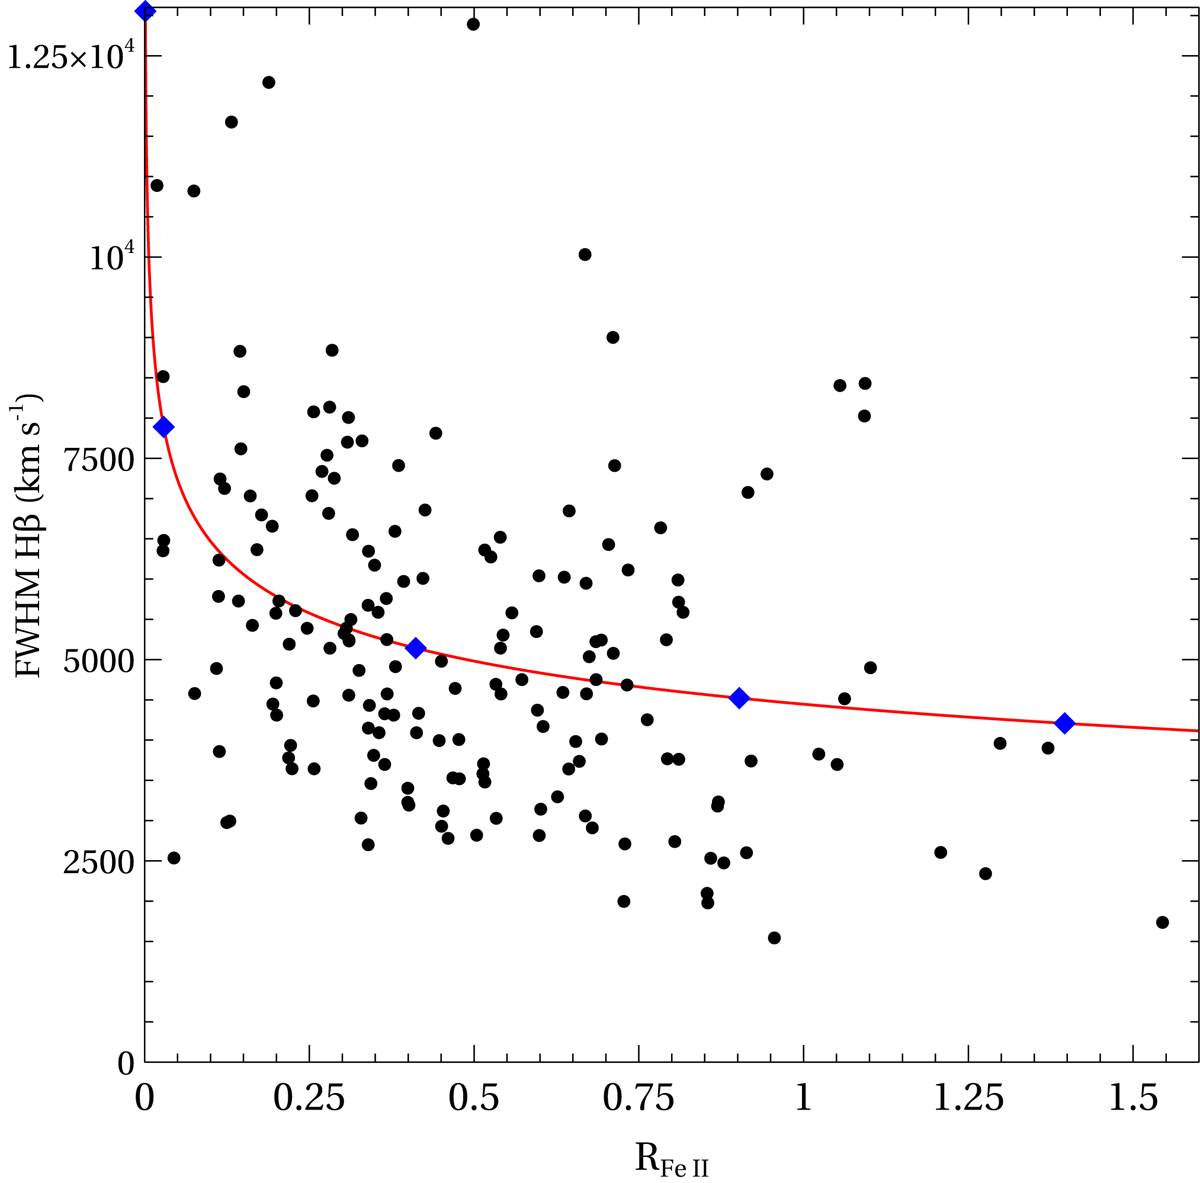
Position of reduced Shen quasars (black dots) on the FWHM(Hβ)–RFe II plane. The decay curve is indicated in red. Blue diamonds indicate the boundaries of unit distance intervals along the curve after the axes are normalized to their respective sample means; the chosen zero point is shown first (uppermost center) and distance increasing toward the lower right.
Current usage metrics show cumulative count of Article Views (full-text article views including HTML views, PDF and ePub downloads, according to the available data) and Abstracts Views on Vision4Press platform.
Data correspond to usage on the plateform after 2015. The current usage metrics is available 48-96 hours after online publication and is updated daily on week days.
Initial download of the metrics may take a while.