Fig. 8.
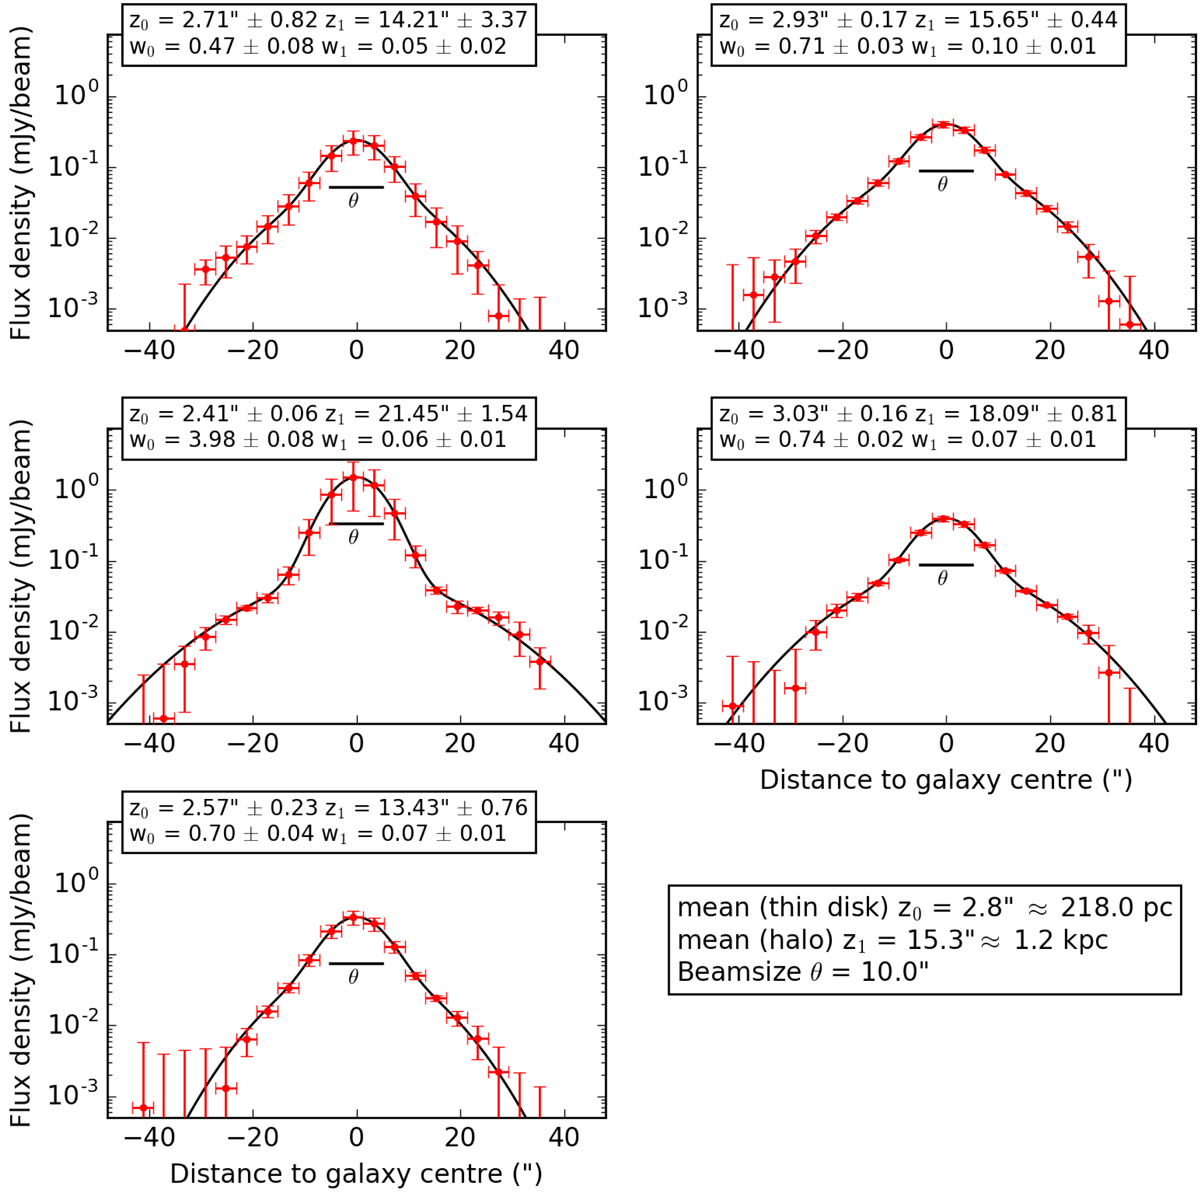
Strip fitting with NOD3 for five strips of NGC 4013 on the combined (C- and D-configuration) C-band data with a two-component Gaussian fit (![]() = 0.05). The first plot is at 75″ on the major axis and the last plot is at −75″ on the major axis from the center. The red dots represent the mean intensity of each box and the black line is the fit to the data done by NOD3. The black horizontal line shows the size of the beam θ. The parameters of the exponential fit function are given in the boxes on top of each strip. The mean of the four scale heights omitting the central strip as well as the beam size are given in the box to the lower right.
= 0.05). The first plot is at 75″ on the major axis and the last plot is at −75″ on the major axis from the center. The red dots represent the mean intensity of each box and the black line is the fit to the data done by NOD3. The black horizontal line shows the size of the beam θ. The parameters of the exponential fit function are given in the boxes on top of each strip. The mean of the four scale heights omitting the central strip as well as the beam size are given in the box to the lower right.
Current usage metrics show cumulative count of Article Views (full-text article views including HTML views, PDF and ePub downloads, according to the available data) and Abstracts Views on Vision4Press platform.
Data correspond to usage on the plateform after 2015. The current usage metrics is available 48-96 hours after online publication and is updated daily on week days.
Initial download of the metrics may take a while.