Open Access
Fig. 15.
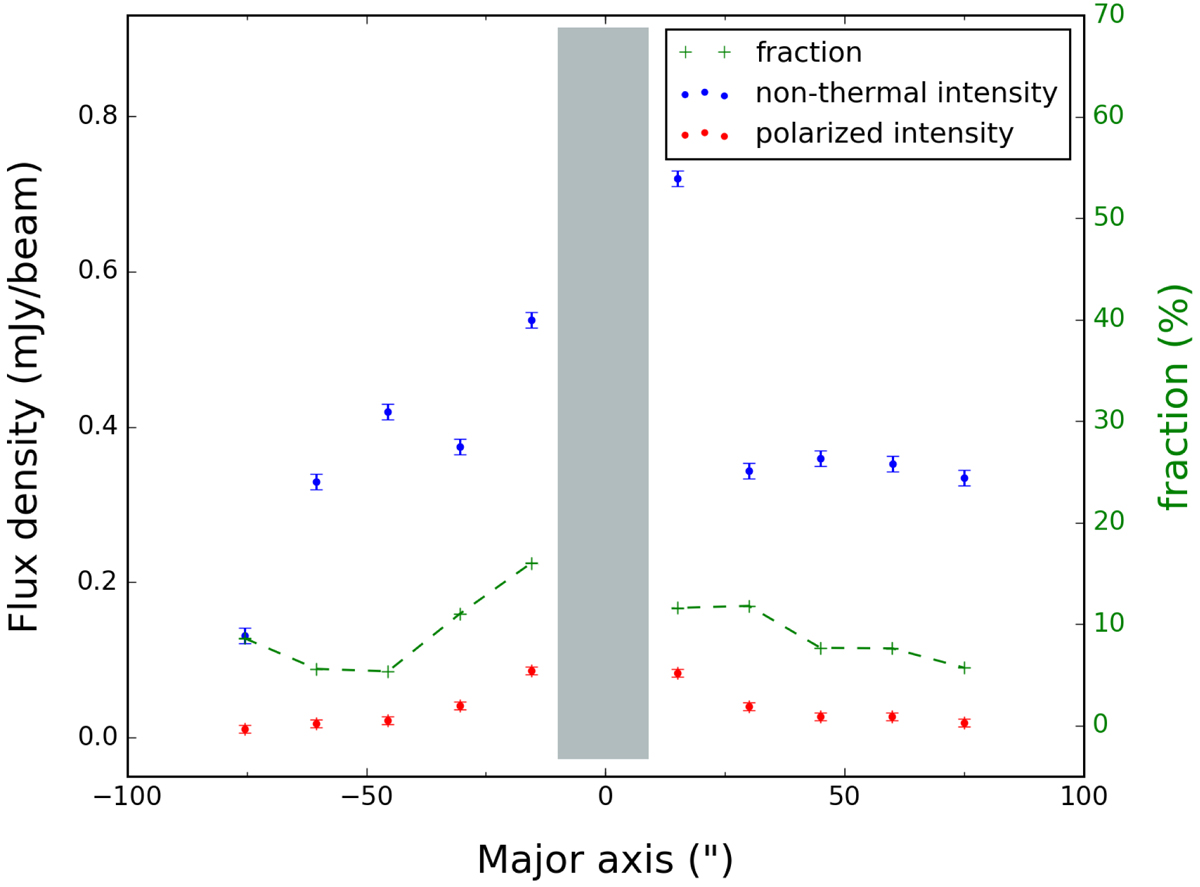
NGC 4013 box integration along the major axis with a box size of 15″ × 15″, showing the nonthermal intensity (blue data points), the polarized intensity (red data points) as well as the degree of polarization (green) of C-band. The grey box shows the region of the central source, where the data are not considered.
Current usage metrics show cumulative count of Article Views (full-text article views including HTML views, PDF and ePub downloads, according to the available data) and Abstracts Views on Vision4Press platform.
Data correspond to usage on the plateform after 2015. The current usage metrics is available 48-96 hours after online publication and is updated daily on week days.
Initial download of the metrics may take a while.