Fig. 14.
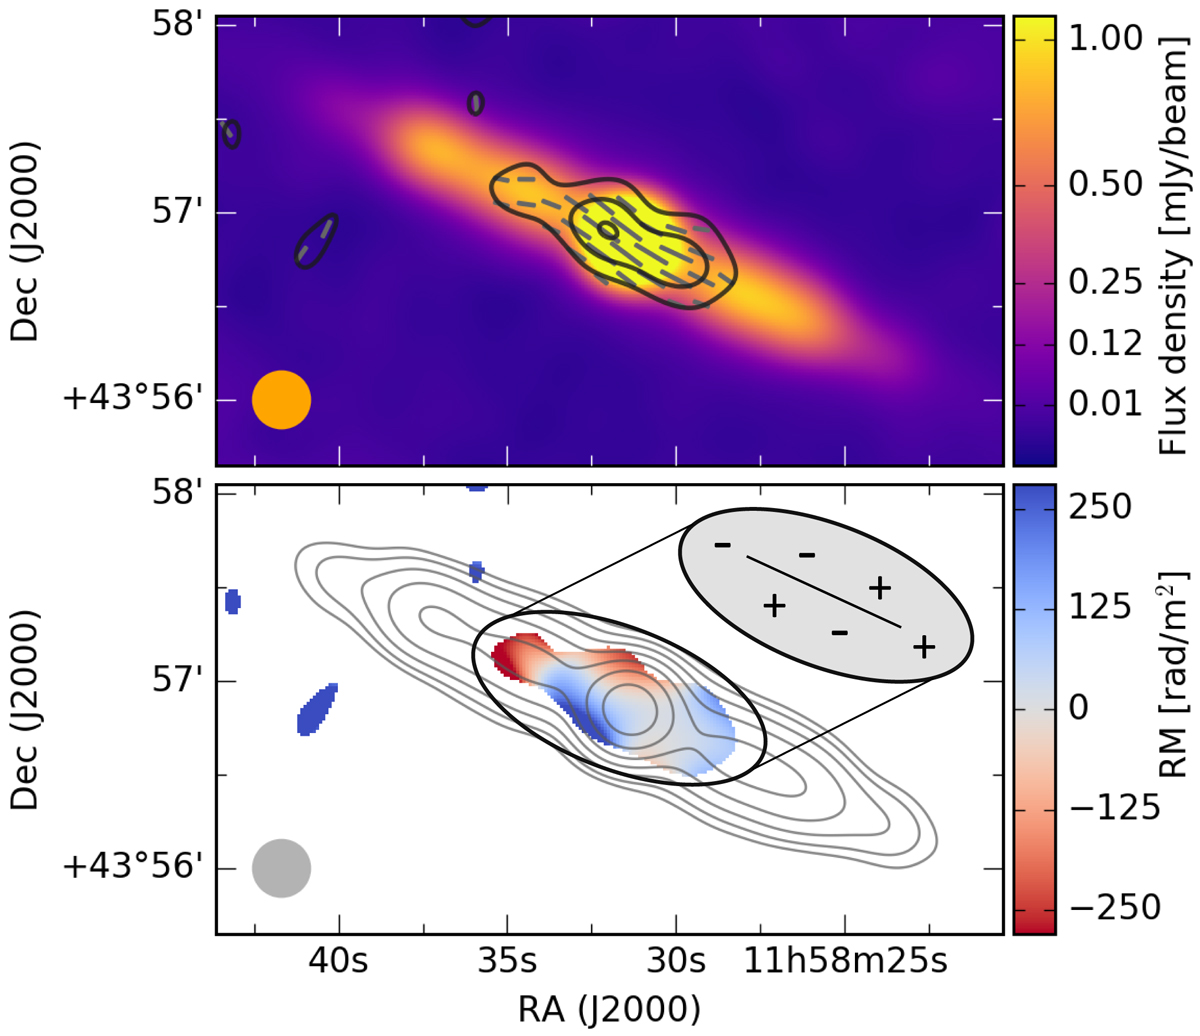
NGC 4013 images from RM-synthesis. Top: total intensity color image with polarization contours at 3, 9, 12σ levels with σ of 11.6 μJy. Magnetic field orientations are shown in black. Bottom: RM map of NGC 4013 from C-band on Stokes I contours with a uv-taper of 12 kλ and Gaussian smoothing resulting in a beam size of 18″ × 18″. Contours start at the 3σ level with a σ of 15.0 μJy beam−1 and increase in powers of 2 (up to 256). The RM map is cut at the 3σ level of 35 μJy beam−1 of the polarized intensity map. The mean RM error is 25 rad m−2.
Current usage metrics show cumulative count of Article Views (full-text article views including HTML views, PDF and ePub downloads, according to the available data) and Abstracts Views on Vision4Press platform.
Data correspond to usage on the plateform after 2015. The current usage metrics is available 48-96 hours after online publication and is updated daily on week days.
Initial download of the metrics may take a while.