Fig. C.1.
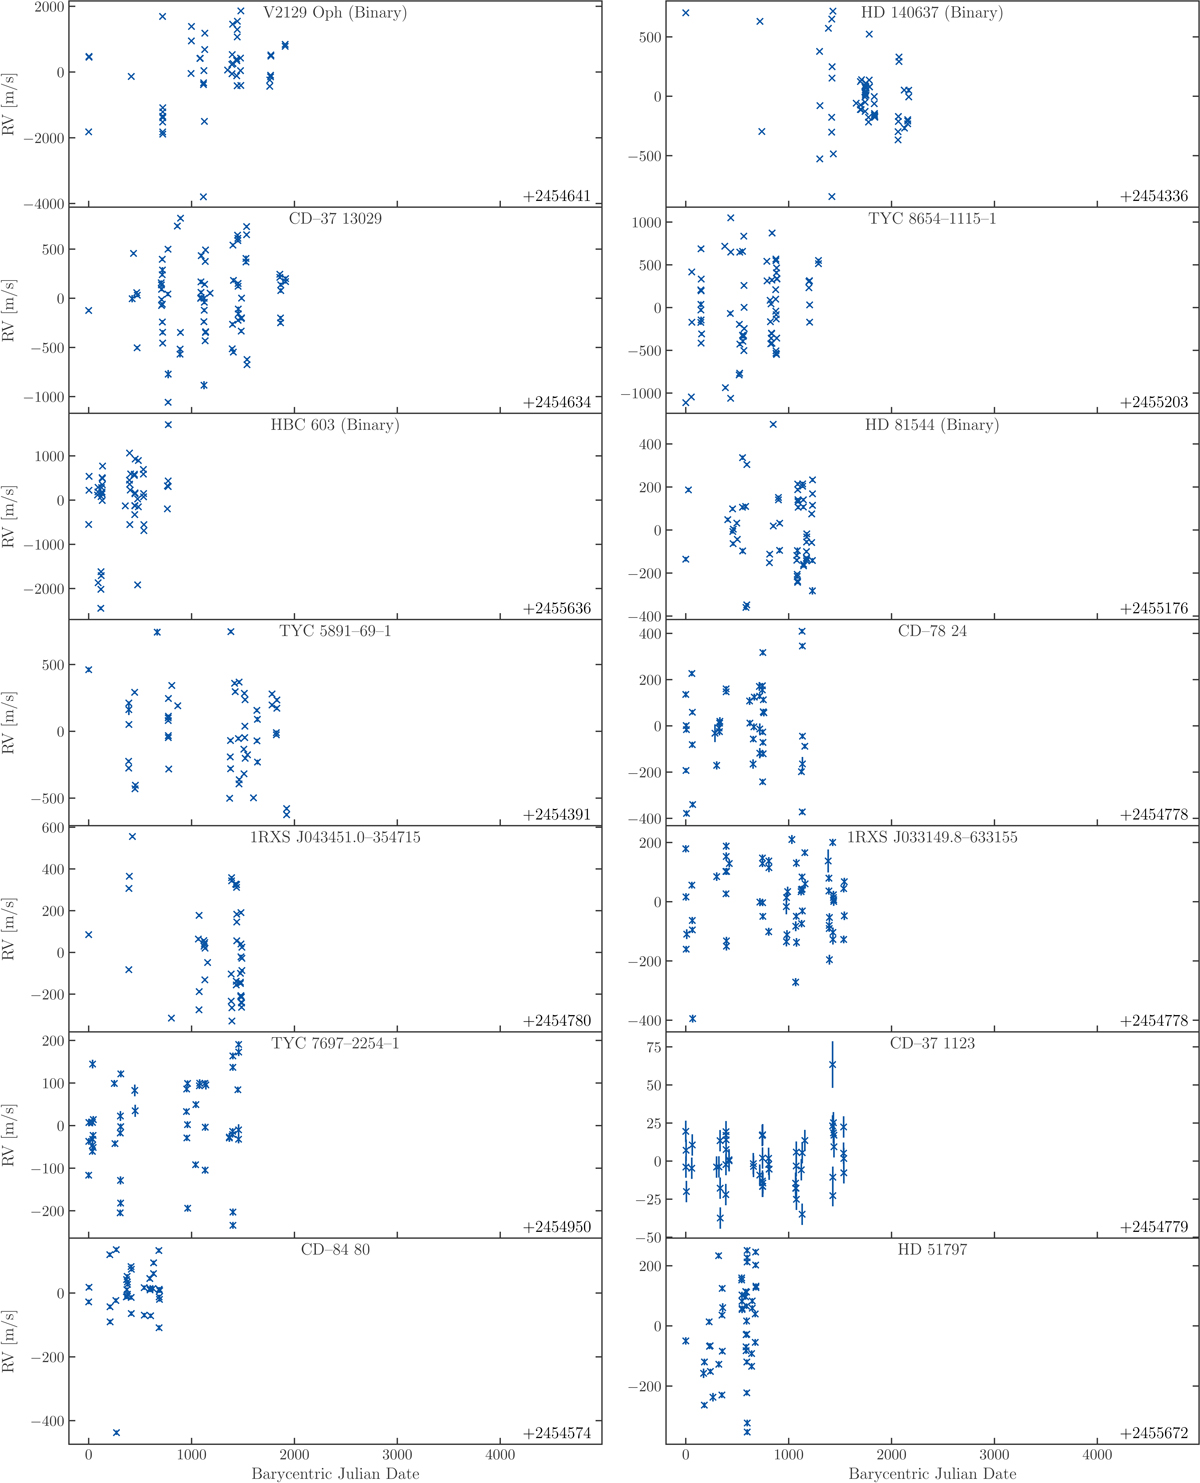
Radial velocity data for all 27 stars after removing the bad data as described in Sect. 2 and subtracting the mean of each data set. Green symbols denote HARPS and blue symbols FEROS data. The offset of the Julian Date on the x-axis is given in the bottom right of each plot. The green vertical lines mark the fiber change of HARPS where the data sets were split. One can see how some data show clear jumps there while others do not. Jumps in the PVD in Fig. 2 as in HD 51062 or HD 25457 can be explained by clustered (e.g., HD 25457) or relatively sparse (e.g., HD 51062) data.
Current usage metrics show cumulative count of Article Views (full-text article views including HTML views, PDF and ePub downloads, according to the available data) and Abstracts Views on Vision4Press platform.
Data correspond to usage on the plateform after 2015. The current usage metrics is available 48-96 hours after online publication and is updated daily on week days.
Initial download of the metrics may take a while.