Fig. 4.
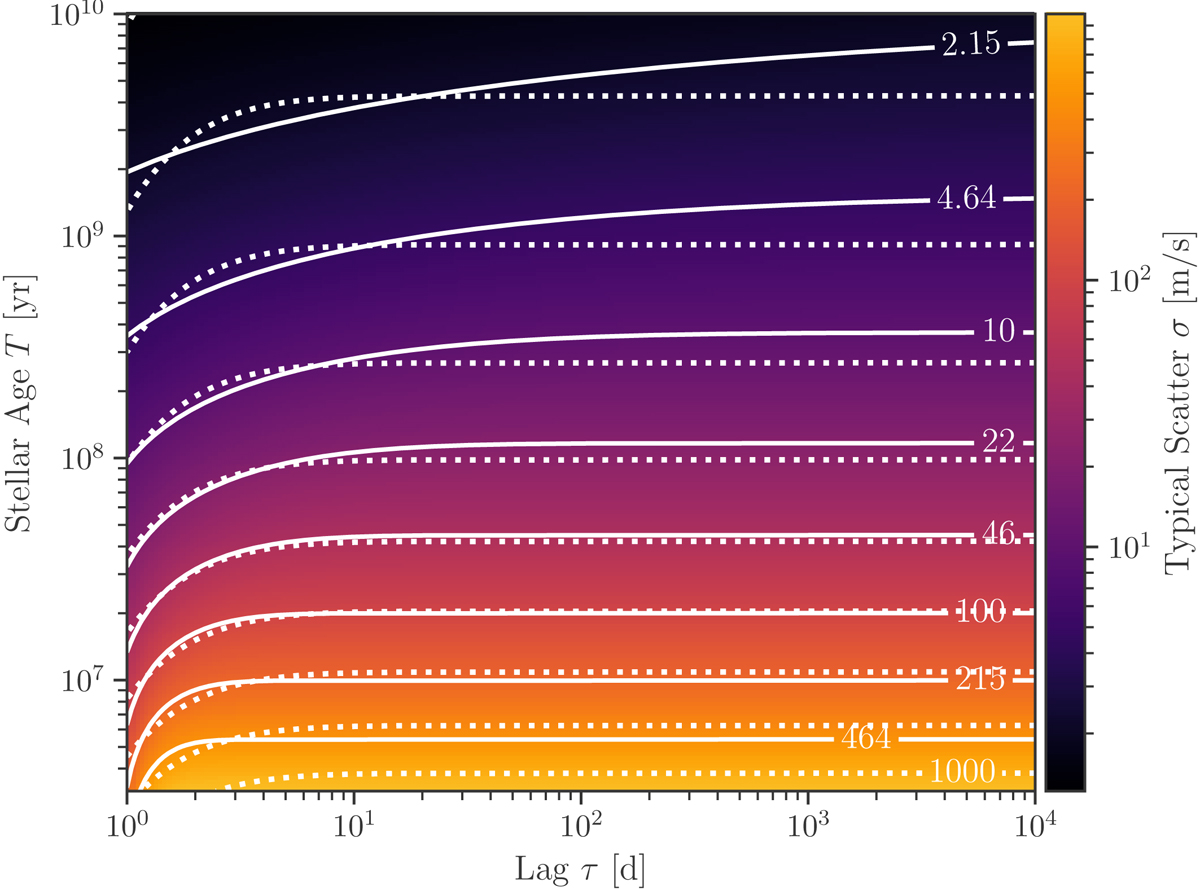
Fitted activity model to the PV data excluding HD 51062. This model has been subtracted in Fig. 3. The color code and white solid lines with contour levels show the more complex model (b) of Eq. (6). As expected, the most important parameter is age. The increase of significant activity timescales with age can also be seen: 99% of the final activity is reached after ∼5 d for a 10 Myr-old star, but only after ∼30 yr for a 10 Gyr-old star. The black dashed lines show the simpler model (a) of Eq. (5) where the timescales are forced to be the same for all ages.
Current usage metrics show cumulative count of Article Views (full-text article views including HTML views, PDF and ePub downloads, according to the available data) and Abstracts Views on Vision4Press platform.
Data correspond to usage on the plateform after 2015. The current usage metrics is available 48-96 hours after online publication and is updated daily on week days.
Initial download of the metrics may take a while.