Fig. 2.
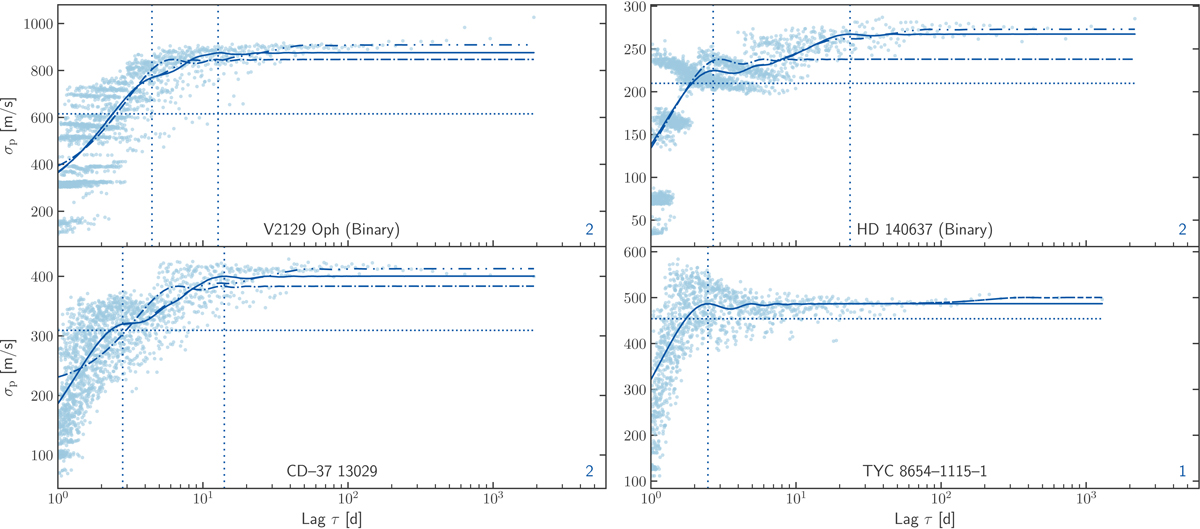
Pooled results for the first 6 stars. Find plots for the remaining 21 stars in Fig. D.1. Blue symbols denote FEROS data and green symbols HARPS data. The lines show the best fits for the different numbers of sinusoidal signals fitted: dotted: zero signal (constant), dash-dotted: one signal, dashed: two signals, dash-dot-dotted: three signals. The solid line replaces the line which qualified as best fit using the F-test described in Sect. 3.4. The dotted vertical lines represent the periods of the identified signals and the number in the bottom right corner the number of identified signals. The model parameters are shown in Table 2. We note that σp and not ![]() is shown.
is shown.
Current usage metrics show cumulative count of Article Views (full-text article views including HTML views, PDF and ePub downloads, according to the available data) and Abstracts Views on Vision4Press platform.
Data correspond to usage on the plateform after 2015. The current usage metrics is available 48-96 hours after online publication and is updated daily on week days.
Initial download of the metrics may take a while.