Fig. E.1.
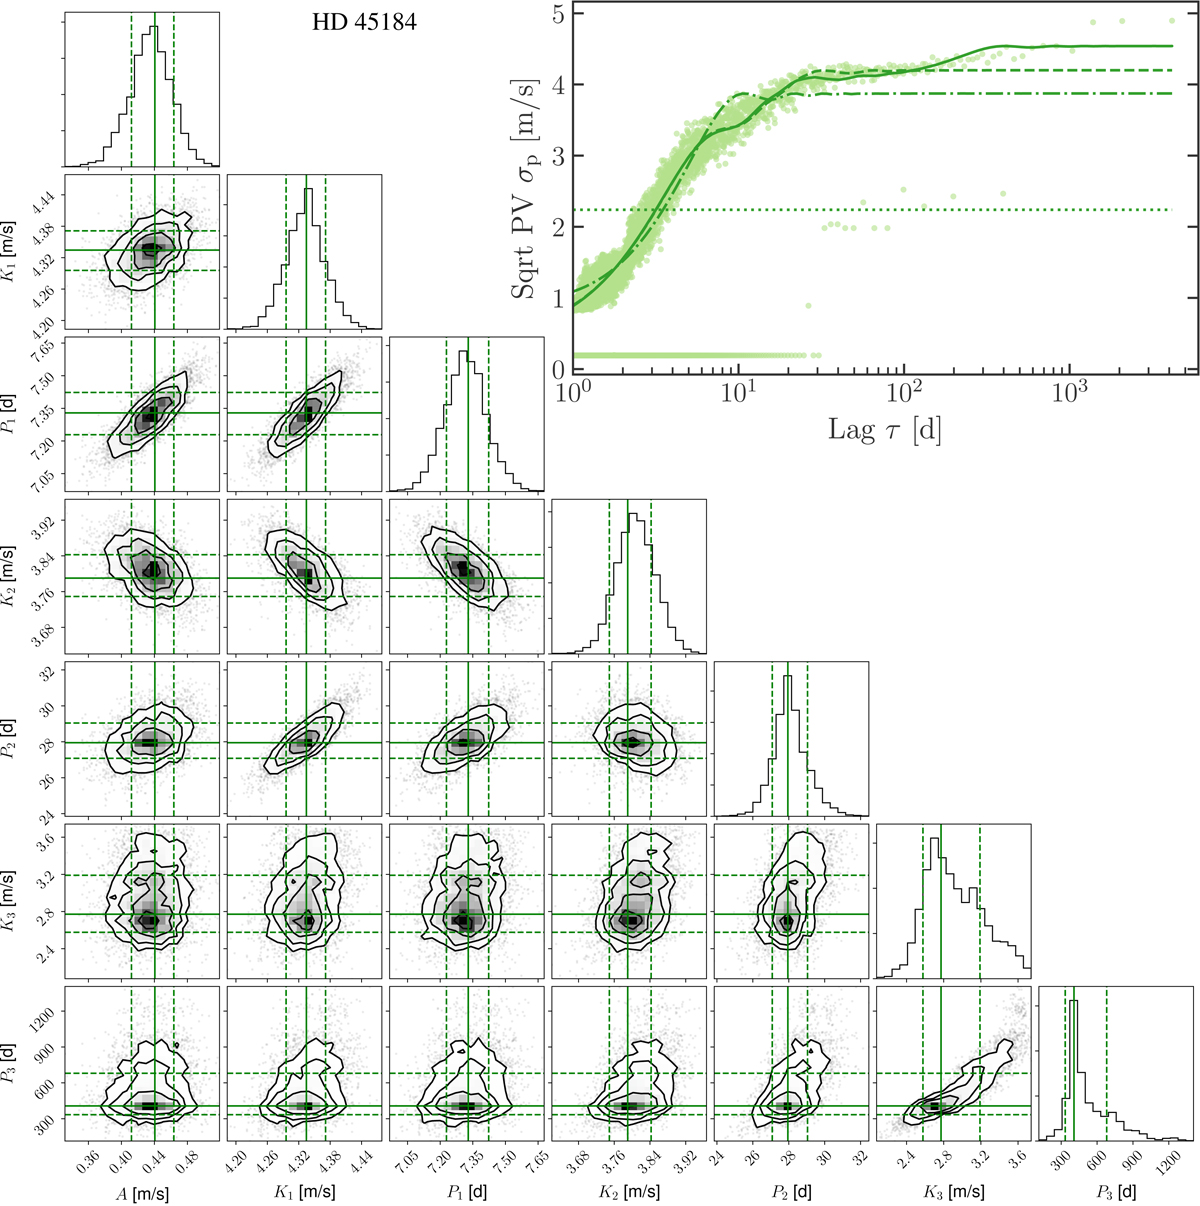
Bottom left: results of the bootstrapping procedure shown as an example for HD 45184. Shown is a corner plot using the Foreman-Mackey (2016) python package. A denotes the offset where as Ki and Pi show the amplitudes and periods of the ith signal, as defined in Eq. (4). The solid green bars denote the fit to the original data, whereas the dashed lines denote the 1σ-confidence levels. In the case of HD 45184, three signals were identified as significant by the F-test, which are shown here. Top right: PV plot: the points mark the results of the PV and the curves the fits with different numbers of sinusoidal signals modeled: dotted: zero (constant), dash-dotted: one sinusoid, dashed: two sinusoids, solid: three sinusoids (best fit). The flat line of points at the bottom are due to the sparse sampling after the HARPS intervention, where only two times two observations are taken within less than 20 days, and those were respectively taken on the same nights; see Fig. C.1.
Current usage metrics show cumulative count of Article Views (full-text article views including HTML views, PDF and ePub downloads, according to the available data) and Abstracts Views on Vision4Press platform.
Data correspond to usage on the plateform after 2015. The current usage metrics is available 48-96 hours after online publication and is updated daily on week days.
Initial download of the metrics may take a while.