Fig. 6.
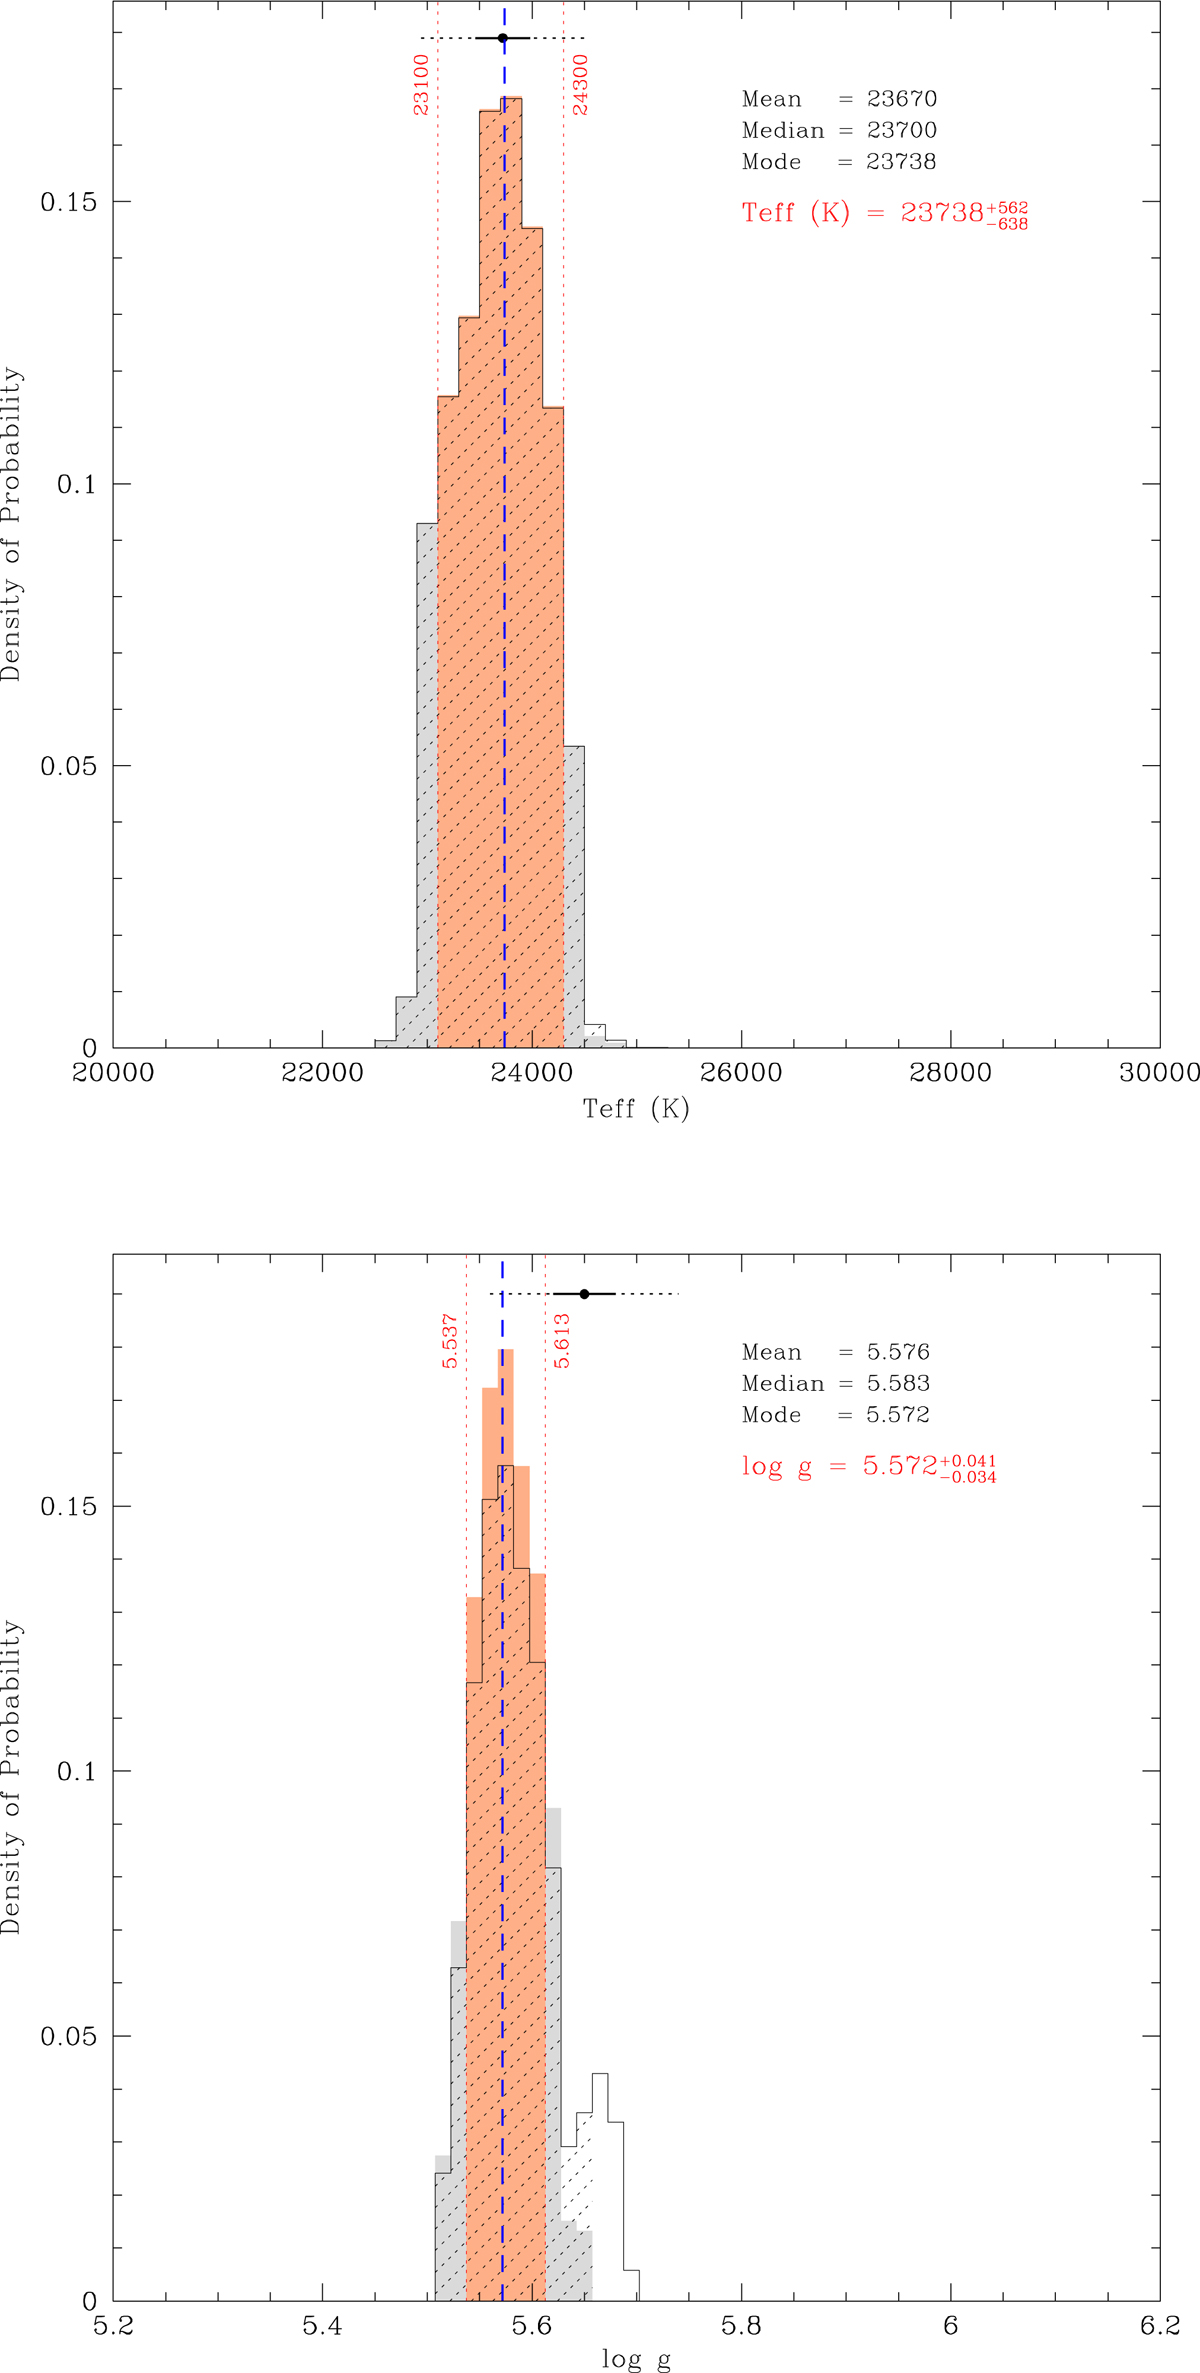
Probability distributions for Teff (top panel) and log g (bottom panel) around the optimal seismic solution for TIC 278659026. Two distributions are superimposed: one resulting from the full sample including all secondary optima (black histograms) and the other computed from a restricted sample focusing on the global optimum (red and gray shaded histogram). This restricted sample is built from excluding parts of the parameter space as indicated in the bottom panel for example and in some panels of Figs. 7–10, by bins that do not show the dotted hatched areas. The red-shaded areas delimited by the red vertical dotted lines contain 68% of the restricted probability distribution and provide our estimate of the 1σ error range for the quantity considered. For internal physical consistency of the derived parameters, the adopted value is that from the optimal model (blue vertical dashed line), which closely corresponds to the mode (maximum) of the distribution. The black dots, and their associated horizontal lines, indicate the measurement obtained independently from spectroscopy, and the 1σ (solid) and 3σ (dotted) ranges around that value.
Current usage metrics show cumulative count of Article Views (full-text article views including HTML views, PDF and ePub downloads, according to the available data) and Abstracts Views on Vision4Press platform.
Data correspond to usage on the plateform after 2015. The current usage metrics is available 48-96 hours after online publication and is updated daily on week days.
Initial download of the metrics may take a while.