Fig. 5.
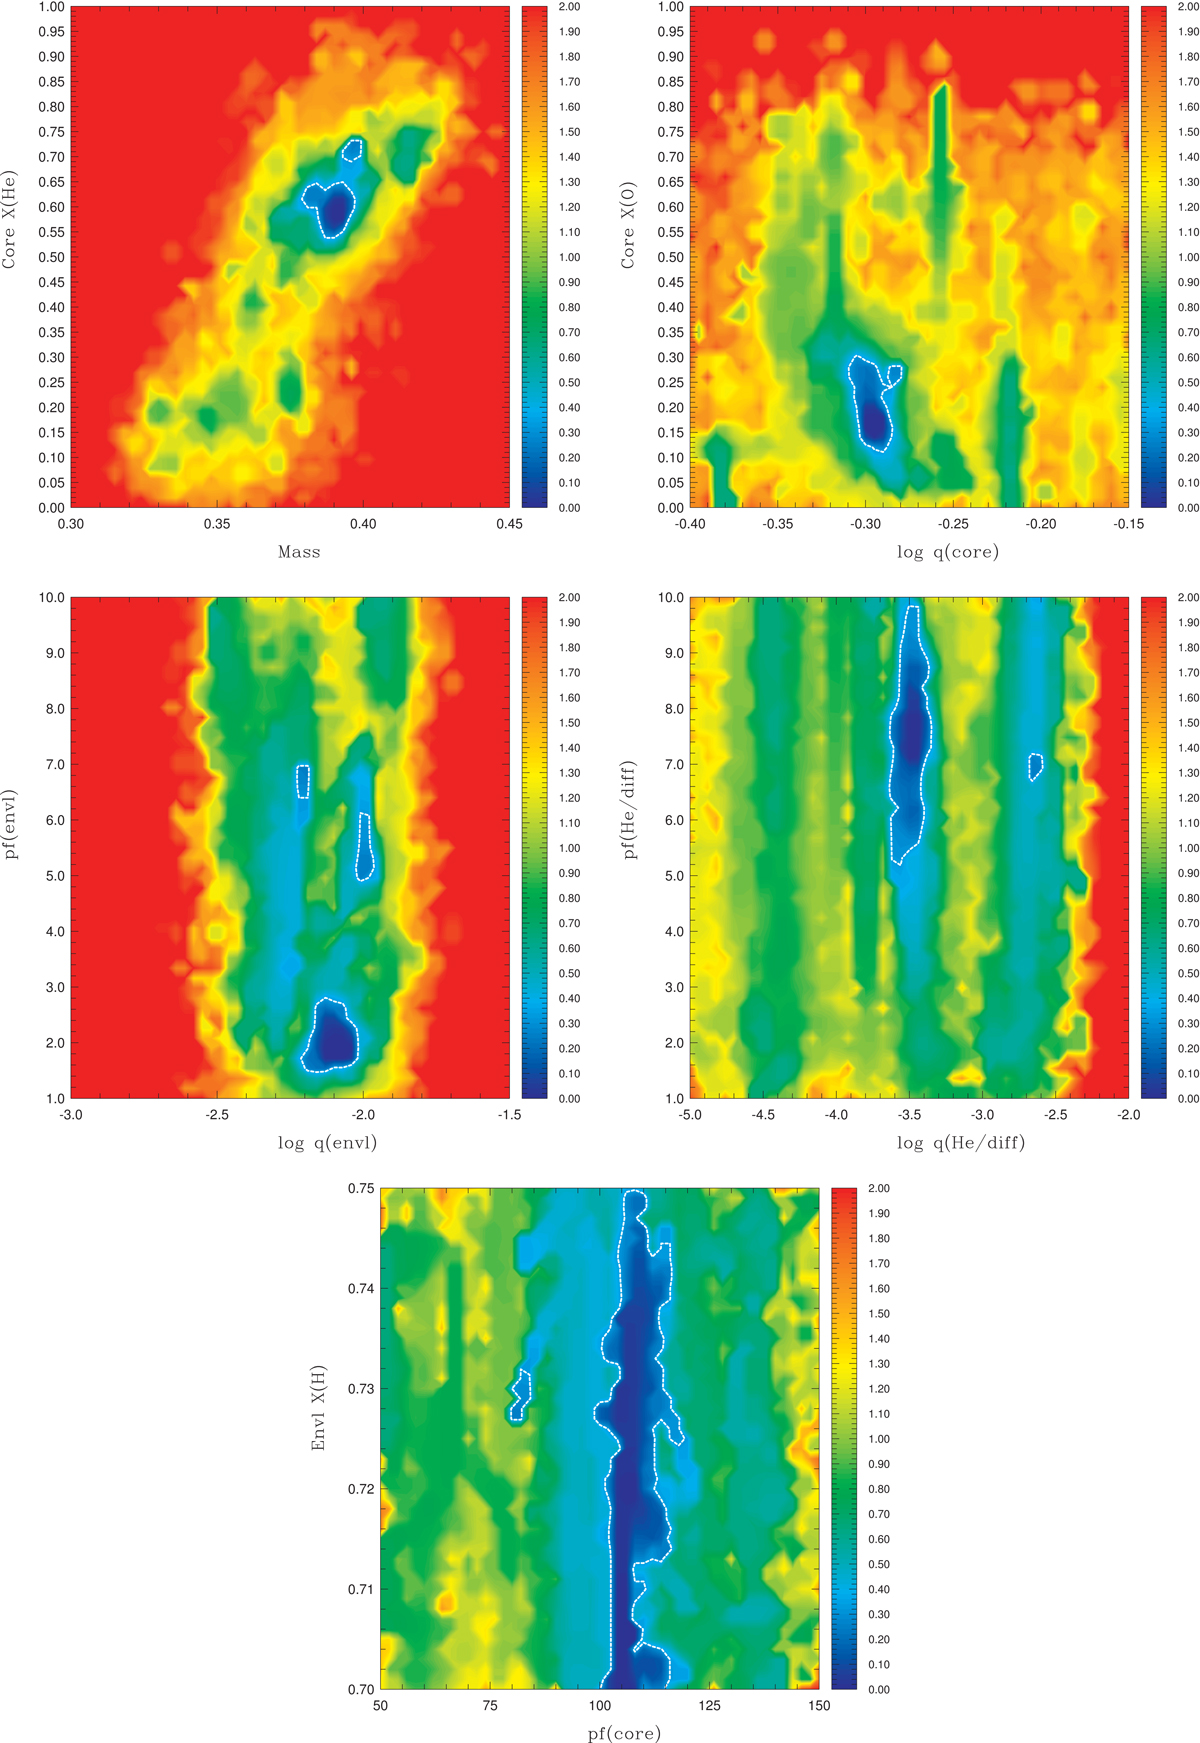
log S2 projection maps for pairs of primary model parameters showing location and shape of best-fitting regions in parameter space (see text for more details). The value S2 is normalized to one at minimum and the color scale is logarithmic. Dark blue indicates the best-fit regions and the dotted contour line is an estimate of the 1σ confidence level, obtained in a similar way to that described by Brassard et al. (2001).
Current usage metrics show cumulative count of Article Views (full-text article views including HTML views, PDF and ePub downloads, according to the available data) and Abstracts Views on Vision4Press platform.
Data correspond to usage on the plateform after 2015. The current usage metrics is available 48-96 hours after online publication and is updated daily on week days.
Initial download of the metrics may take a while.