Fig. 12.
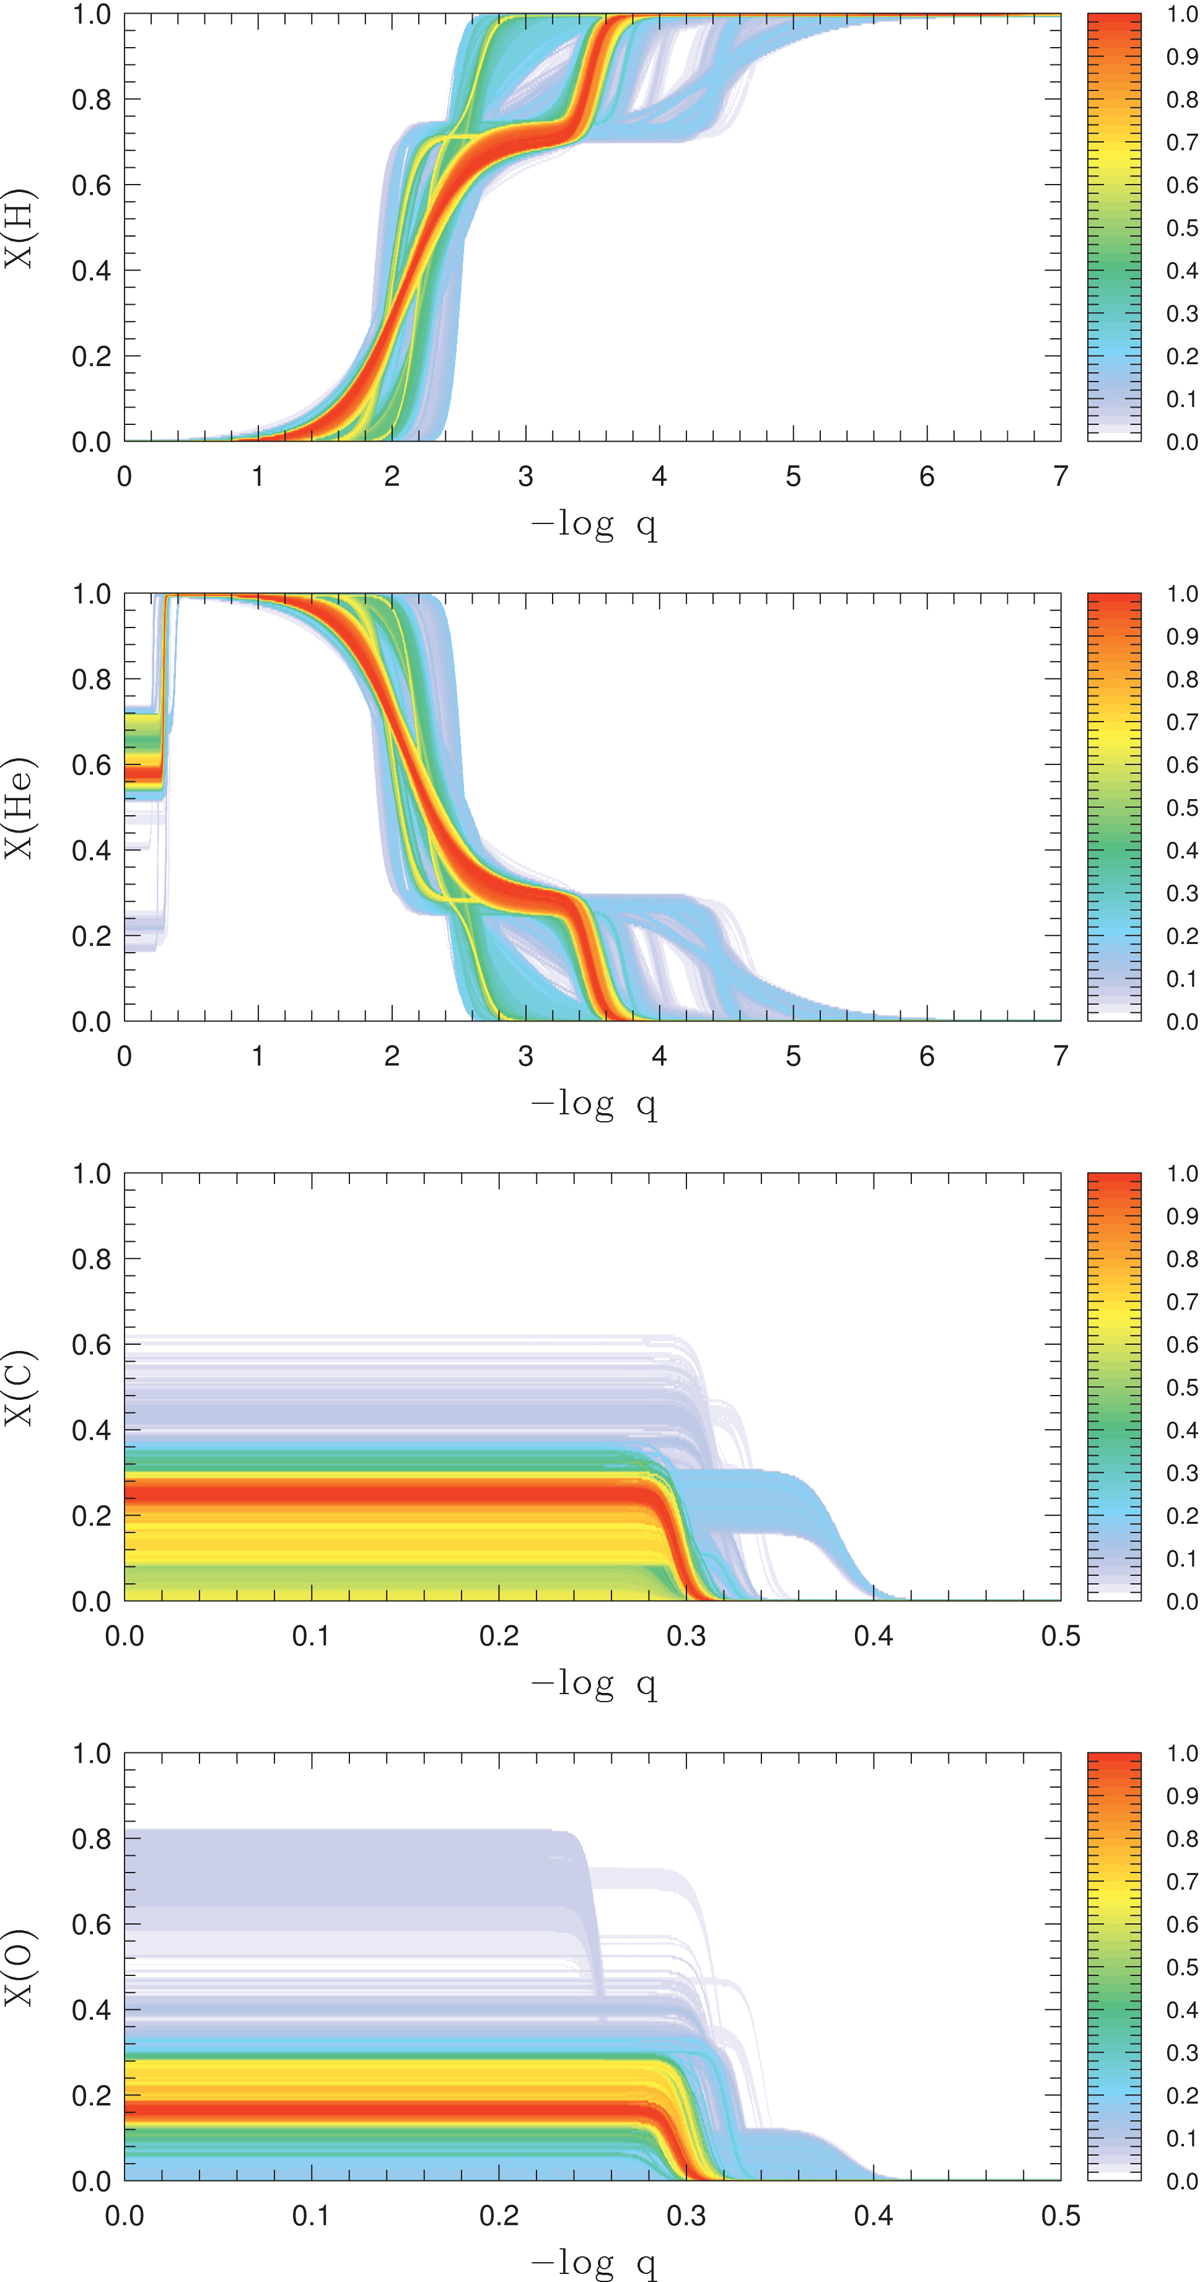
Probability distributions (color scale) normalized to one at maximum as functions of the fractional mass depth, log q = log[1 − m(r)/M⋆], obtained, from top to bottom, for the mass fraction of hydrogen, helium, carbon, and oxygen inside TIC 278659026. The red areas indicate the values, as functions of log q, corresponding to the best-matching seismic models. These distributions are derived from the evaluation of 1 555 425 stellar models calculated during exploration of parameter space.
Current usage metrics show cumulative count of Article Views (full-text article views including HTML views, PDF and ePub downloads, according to the available data) and Abstracts Views on Vision4Press platform.
Data correspond to usage on the plateform after 2015. The current usage metrics is available 48-96 hours after online publication and is updated daily on week days.
Initial download of the metrics may take a while.