Fig. 7
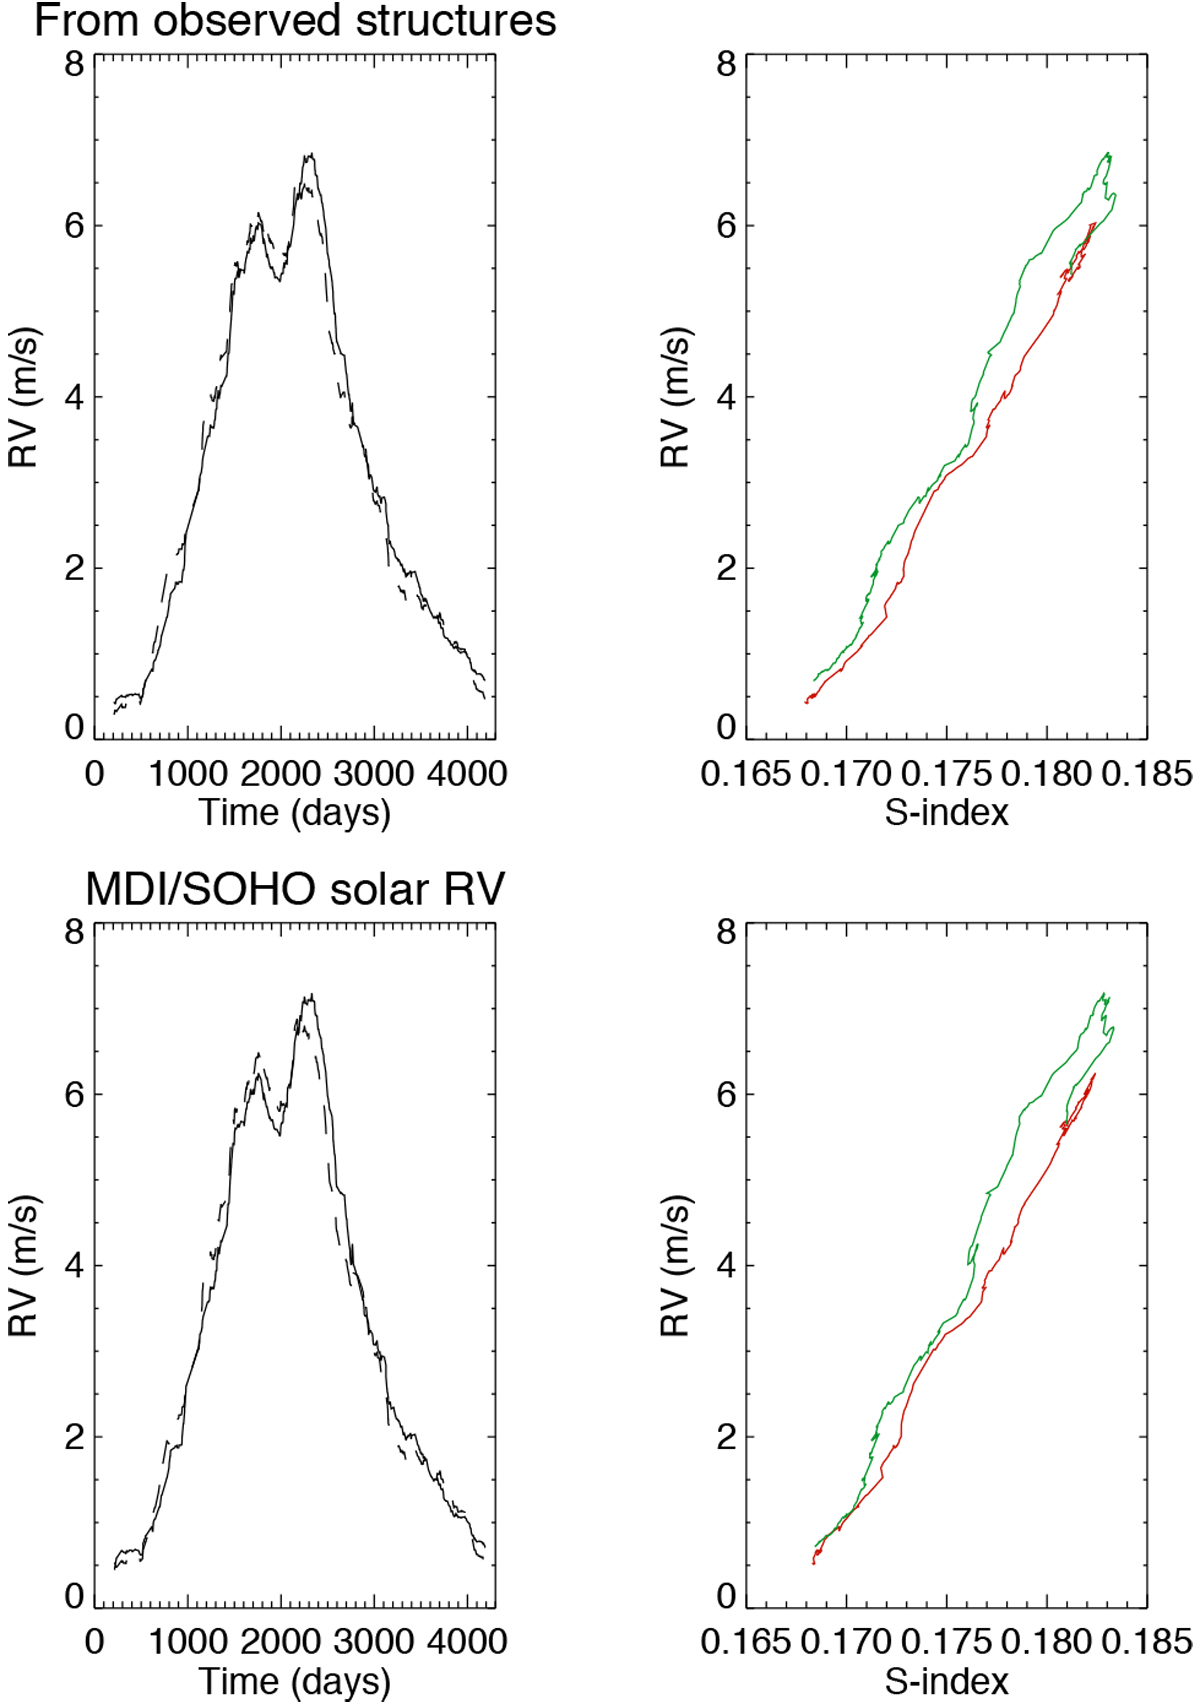
Relative velocity (solid line), RV deduced from the linear relation with Sacramento Peak S-index (dashed line) vs. time (left panels), and RV vs. S-index (right panels, in red for ascending phase and in green for descending phase). Upper panels: RVs reconstructed from observed structures (Meunier et al. 2010a). Lower panels: RVs reconstructed from MDI/SOHODopplergrams (Meunier et al. 2010b).
Current usage metrics show cumulative count of Article Views (full-text article views including HTML views, PDF and ePub downloads, according to the available data) and Abstracts Views on Vision4Press platform.
Data correspond to usage on the plateform after 2015. The current usage metrics is available 48-96 hours after online publication and is updated daily on week days.
Initial download of the metrics may take a while.